
Figure 5.
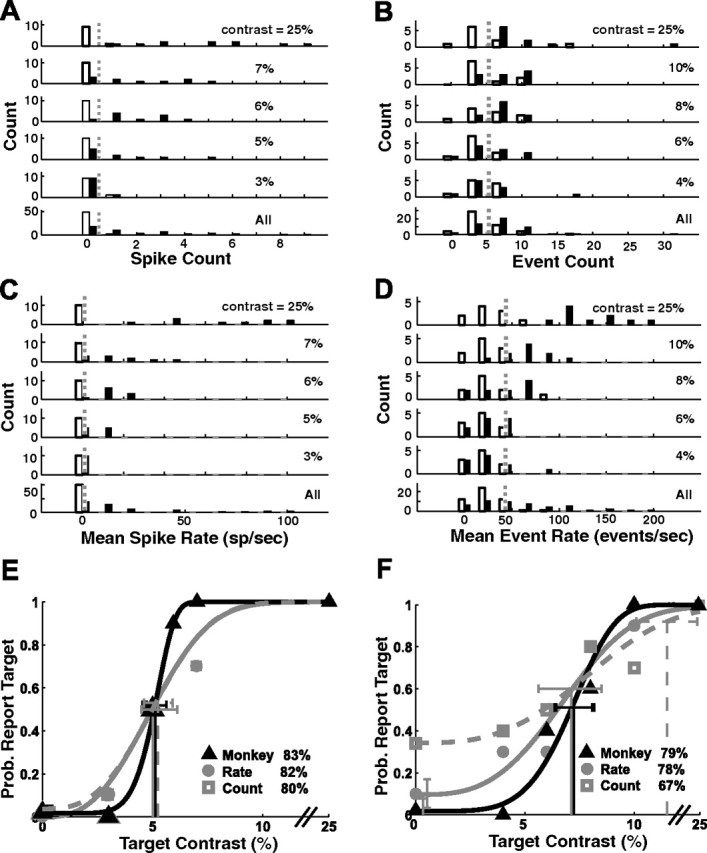
Response distributions and neurometric/psychometric functions. A, Distributions of spike counts for target-present trials (filled bars) and target-absent trials (open bars) from the SU recording session shown in Figure 4A. Spikes were counted during the integration period described in Figure 1B. B, MU spike counts from the recording session shown in Figure 4B. Dashed vertical lines in A and B are optimal criteria for the summation model. C, D, Same as A and B, but for spike rates rather than spike counts. E, F, Comparison of the monkey's performance with that of the count and rate models that base their decisions on the neural responses in single trials. Each point represents the probability that the observer (monkey or model) would indicate the presence of the target. E, SU neurometric and psychometric functions (same experiment as Fig. 4A). F, MU neurometric and psychometric functions (same experiment as Fig. 4B). Overall accuracy is listed in each panel. Detection thresholds (T) are shown with thin vertical lines. Error bars show 95% confidence intervals for threshold (horizontal) and false-alarm rate (vertical). Prob., Probability.