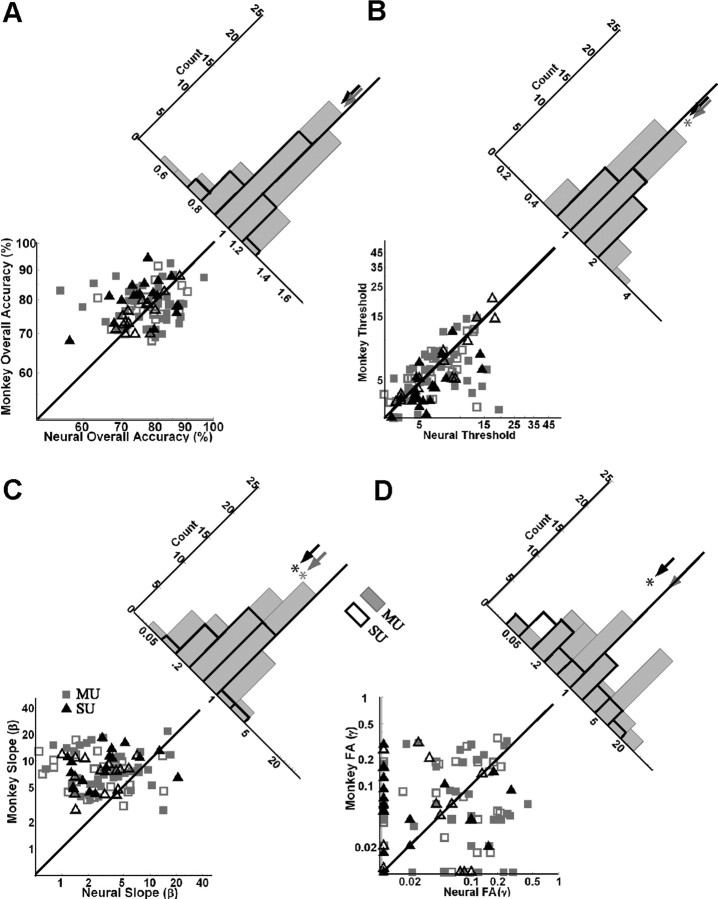
Figure 6.
Scatter plots of the parameters of the monkey's psychometric functions versus the parameters of the neurometric function for the rate model. A, Overall accuracy. B, Detection threshold (T). C, Slope (β). D, False-alarm rate (FA; γ). Filled data points indicate experiments in which a bootstrap test found a significant difference in a parameter value between the monkey and the neuron(s). Gray squares, MU (n = 62); black triangles, SU (n = 33). Histograms show the ratio of the values for each parameter, neuron(s)/monkey. To compute the ratio in D, at sites in which the monkey's false-alarm rate was equal to zero, it was arbitrarily set to 1%. The filled gray histograms are for MU, and the black outlined histograms are for SU. Arrows (gray, MU; black, SU) indicate median ratio. Asterisks indicate significant difference between the model and the monkey based on a paired t test. Diagonal lines are unity lines, not fits to the data.

