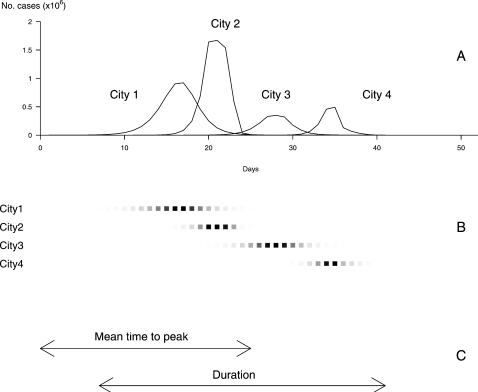
Figure 2. Definition of a pandemic profile and of the outcome variables considered.
(A) The upper graph represents the daily incidence of flu in each city affected by the influenza pandemic. The first outcome variable, the cumulated number of cases at the end of the pandemic within all affected cities, is given by sum of areas under the curves of incidence. The second outcome variable, the number of cities affected by the pandemic is given by the number of incidence curves. (B) The day of peak is defined as the day when the incidence rate is maximal. It is represented in each city affected by the pandemic by a deep black square, the level of grey in the other squares being proportional with the daily incidence of flu (scaled separately on the maximum for each city). The cities are represented in the order in which they are affected by the pandemic. (C) The third outcome variable, the mean time to peak, is calculated as the mean time between the start of the pandemic and its peak over all cities affected. The fourth outcome variable represented is the total duration of the pandemic and is defined by the time lag between the apparition of the first case in the first city affected and the last one in the last city. The fifth variable not represented on this graph is the standard deviation of time to peak, calculated as the standard deviation of the time between the start of the pandemic and its peak over all affected cities.

