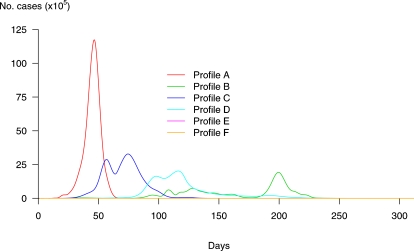
Figure 4. Incidence curves of pandemic profiles identified over 1000 simulated dynamics without control measures.
Curve A corresponds to a fast and massive pandemic. Up to 50% of people would be infected worldwide, and all 52 cities of our network would be affected. The global duration would be 89 days and RA = 4.9. Curve B corresponds to a progressive and long lasting pandemic, where 20% of the global population would be infected in 52 cities of our network. The total duration of the pandemic would be around 297 days, and RB = 1.8. Curve E on the x-axis corresponds to a very mild pandemic where cases would represent only 0.1% of the global population. Curve F on the x-axis represents the profile where despite cases in the initial city, the pandemic does not take off. In this case, the number of cases is around 400, which explains why it does not appear clearly on the graph. The other two curves (D and E) show profiles in between, where 35% and 27% respectively of the global population would be attained in 167 and 291 days respectively.

