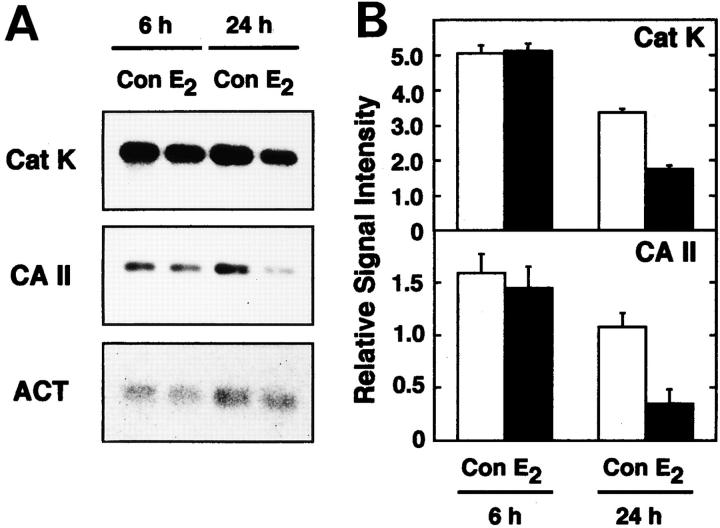
Figure 3.
Negative regulation of mRNA levels for Cat K and CA II by estrogen. (A) Northern blot analysis. Total RNAs (3 μg) from ∼25,000 purified osteoclasts cultured on dentine slices (150 cells/dentine slices) with (E2) or without 0.1 nM E2 (Con) for 6 or 24 h were used as samples. (B) Relative abundance of Cat K and CA II mRNAs. The relative abundance of Cat K and CA II mRNAs on Northern blotting was evaluated from the values of densitometric scanning. The values shown were normalized with respect to the abundance of β-actin (ACT), and expressed as means ± SD of samples from three other independent experiments.

