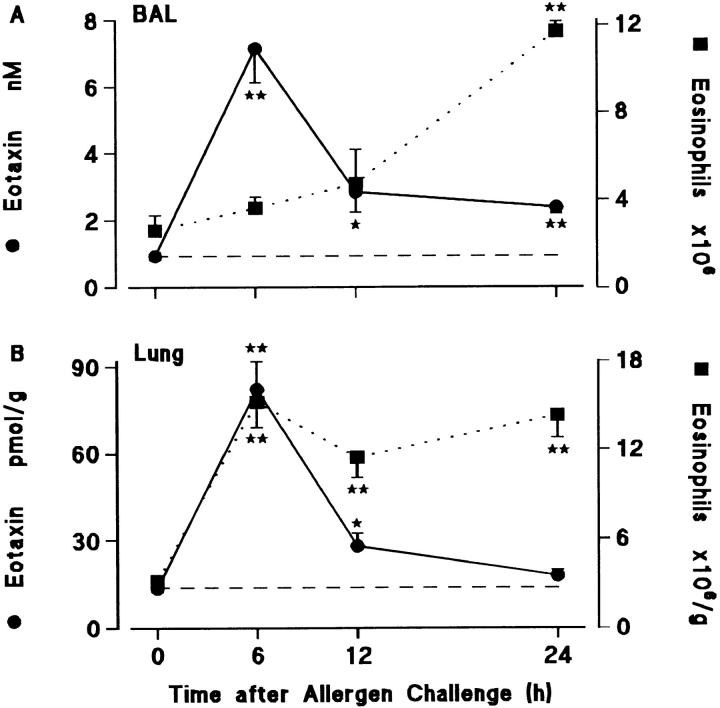
Figure 2.
Time course of eotaxin generation (•, solid line) and eosinophil accumulation (▪, dotted line) in (A) BAL and (B) lung tissue of sensitized guinea pigs after allergen challenge. Results are presented as a mean±SEM (n = 5–9 animals/time point). 0 h represents sensitized/ nonchallenged animals (n = 5). Significant differences from 0 h are indicated as *P <0.05 and **P <0.005. Constitutive levels of eotaxin in BAL fluid and lung tissue are shown by the dashed lines.

