Figure 3.
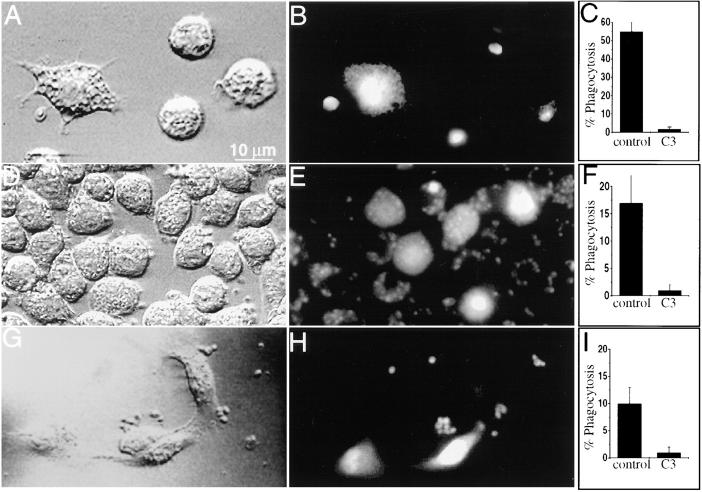
The effect of Rho inhibition on cell morphology and phagocytosis. (A–C) J774 cells were plated on glass and some were injected with C3 exotoxin in a solution containing fura-dextran as a marker. The cells were then incubated with fluoresceinated, opsonized zymosan. (A) Differential interference contrast micrograph. Note the morphological alterations of the left hand, injected cell. (B) Fluorescence emission of the cells shown in A (excitation 360 nm; emission 510 nm). The emission of fura-dextran, demonstrating that only the left hand cell was injected. The emission of fluorescein, which can be seen despite the low excitation wavelength, reveals the labeled zymosan particles. (C) Effect of C3 exotoxin on phagocytosis by cells plated on glass, determined as described in Materials and Methods. Data are means ± SE of 175 control and 160 C3- injected cells (P <0.05.). (D–F) J774 cells were plated on fibronectin and some were injected with C3 exotoxin as above. The cells were then incubated with fluoresceinated, opsonized zymosan. (D) Differential interference contrast micrograph. (E) Fluorescence emission of the cells shown in D. (F) Effect of C3 exotoxin on phagocytosis on fibronectin. Data are means ± SE of 150 control and 74 C3-injected cells (P <0.05). (G–I) FcγRIIA receptor–transfected COS cells were plated on glass coverslips and some were injected with C3 exotoxin as above. The cells were then incubated with fluoresceinated, opsonized zymosan. (G) Differential interference contrast micrograph. (H) Fluorescence emission of the cells shown in G. (I) Effect of C3 exotoxin on phagocytosis by transfected COS cells. Data are means ± SE of 165 control and 75 C3-injected cells (P <0.05). Images are represented of five separate experiments.

