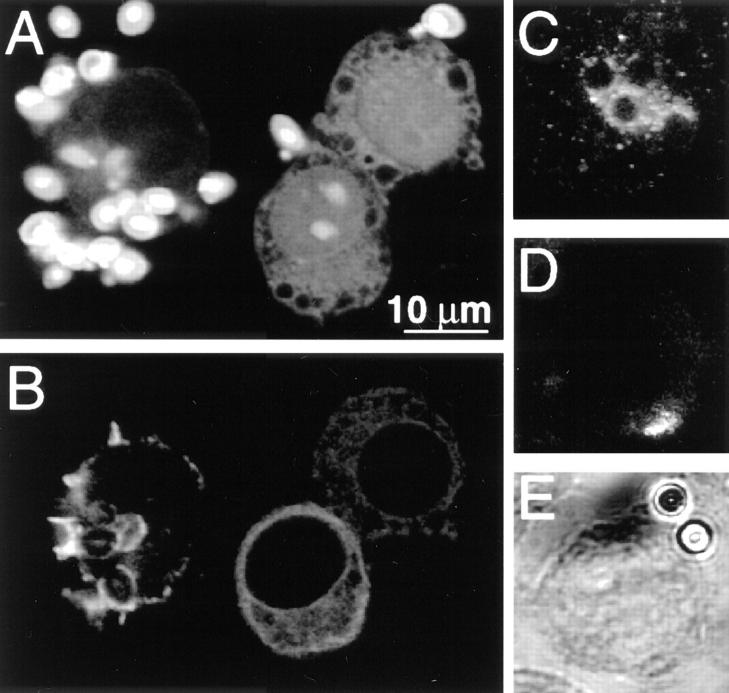
Figure 5.
Effect of C3 microinjection on the accumulation of F-actin and phosphotyrosine at nascent phagocytic cups. Fluoresceinated, opsonized zymosan particles were added for 30 min to J774 cells, some of which had been injected with C3 exotoxin and Lucifer yellow 1 h before. (A–D) Confocal fluorescence images. (A) Green fluorescence emission showing the particles and identifying the injected cells. Note that the two right hand cells were injected, and bound fewer particles compared with the uninjected cell (left hand) (B) Red fluorescence illustrating the distribution of F-actin, stained with rhodamine-phalloidin. Note the F-actin cups in uninjected cells but not in C3-injected cells. (C) Immunostaining of a control cell with antiphosphotyrosine antibody. The accumulation of phosphotyrosine at phagocytic cups is illustrated. (D) Antiphosphotyrosine staining of a C3-injected cell, identified by the emission of Lucifer yellow (not shown). Note the absence of phosphotyrosine accumulation at sites where latex particles adhered (see E). (E) Differential interference contrast micrograph of the cell in D. Images are representative of five experiments of at least 20 cells/experiment.

