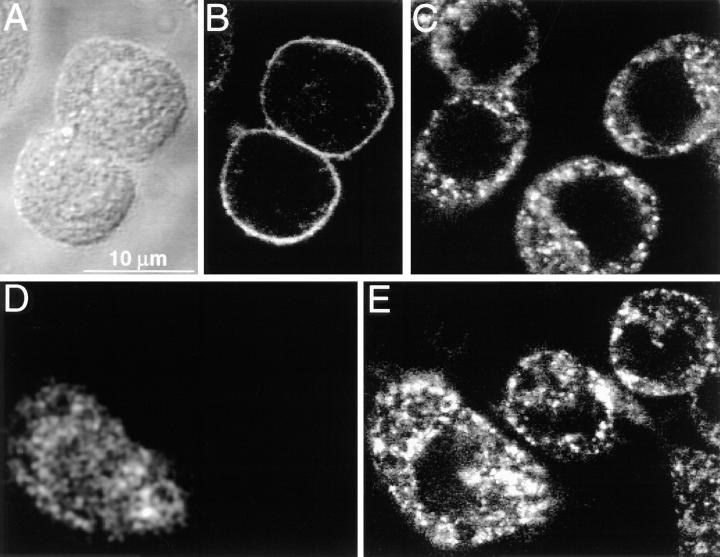
Figure 8.
Transferrin internalization in J774 cells: effect of C3 exotoxin. (A) Differential interference contrast image of J774 cells which had been exposed to Texas red–labeled transferrin for 1 h at 4°C. (B) The cells in A were analyzed by confocal fluorescence microscopy to detect the distribution of transferrin. (C) Cells were initially incubated with Texas red–labeled transferrin as in A and then warmed to 37°C for another hour to promote receptor internalization. A typical confocal micrograph is illustrated. (D and E) Selected cells were injected with C3 exotoxin and Lucifer yellow (as a marker of microinjection) and the whole cell population was then allowed to bind and internalize Texas red–labeled transferrin as in C. (D) Lucifer yellow emission identifying a cell which had been injected with C3 exotoxin ∼1 h before exposure to transferrin. (E) Confocal micrograph illustrating the distribution of transferrin in the same cells as shown in D. Note that internalization occurred similarly in both injected cells (left hand cell in E) and noninjected cells. Representative of three separate experiments, with at least 25 injected cells/experiment.

