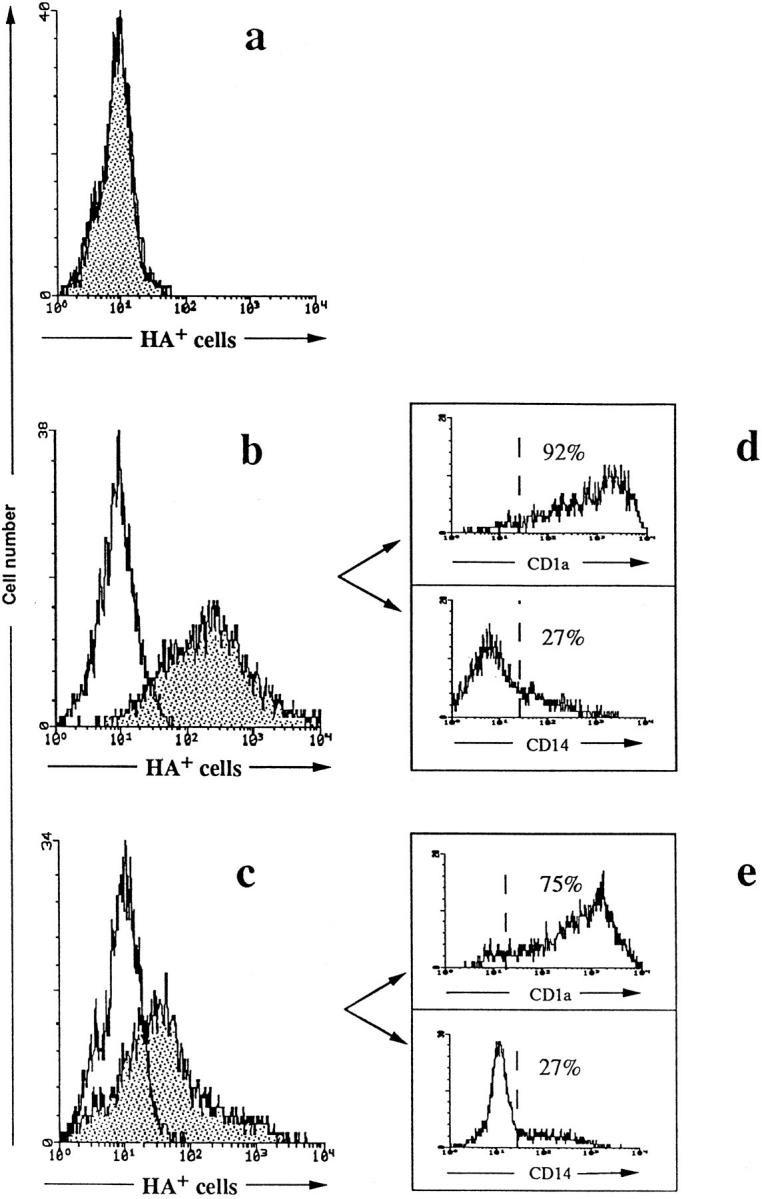
Figure 2.

FACS® analysis of HA expression by CD1a+ DC. DC were either mock-infected (a) or infected with MV-Hallé (b) or MV–LYS-1 (c). On day 2 of infection, cell surface HA expression by single MV-infected DC was analyzed by indirect immunofluorescence using the MV-HA specific antibody, mAb 55, and an FITC-conjugated F(ab′)2 fragment of goat anti–mouse IgG (shaded histogram). A mouse IgG2b was used as isotype control (white histogram). In double immunofluorescence labeling, HA+ cells were electronically gated and the percentages of HA+ cells expressing CD1a or CD14 in both Hallé-infected (d) and LYS-1–infected (e) DC were determined using PE-conjugated anti-CD1a or anti-CD14 mAbs. The dotted lines represent the position of the PE-conjugated control IgG. The data are from a representative experiment out of 10.
