
Figure 6.
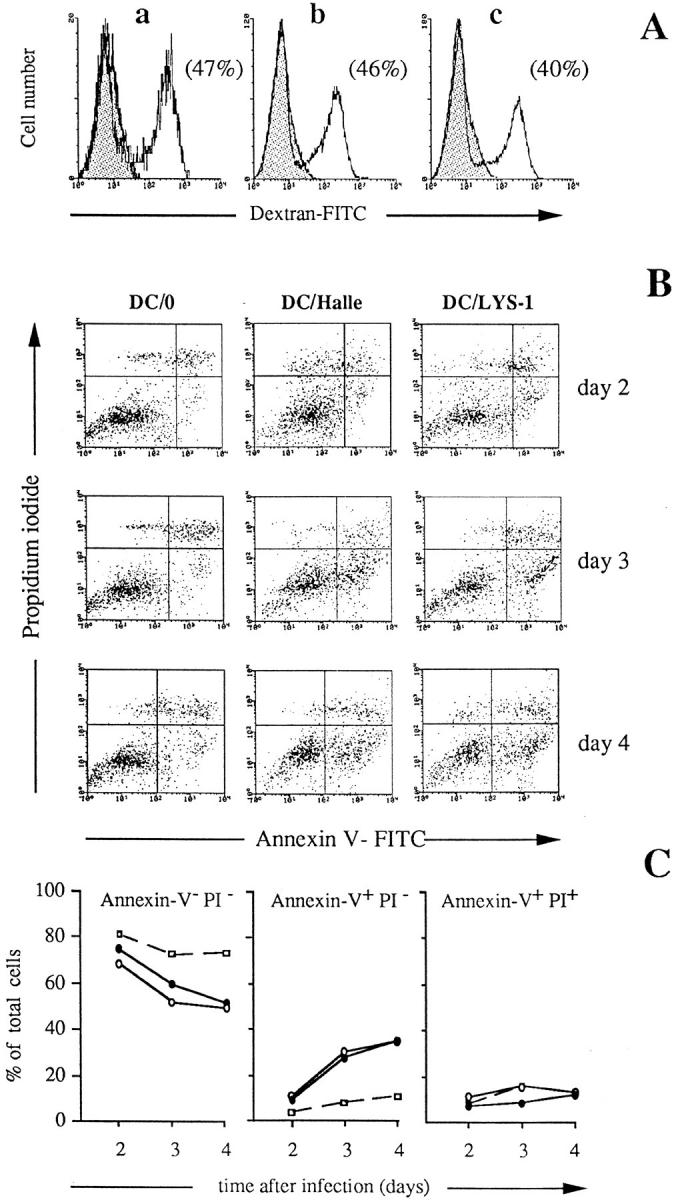
Flow cytometry analysis of dextran-FITC internalization and Annexin V FITC and PI double staining of DC after MV infection. DC were either mock-infected (DC/0) or infected with MV (DC/Hallé; DC-LYS-1) at an MOI of 0.05. (A) Dextran-FITC internalization by mock-infected DC (a), DC infected with MV Hallé (b) and DC infected with MV LYS-1 (c) on day 2 after infection. The cells (2 × 10⁵) were incubated for 15 min in the presence of dextran-FITC either at 37°C (white histogram) or at 0°C for control (shaded histogram). Dextran-FITC uptake by viable cells was analyzed by flow cytometry, after exclusion of dead cells using PI. The numbers in parenthesis represent the percentage of cells which have internalized dextran-FITC. (B and C) On days 2, 3, and 4 after infection, cell viability was determined by flow cytometry analysis of double staining with Annexin V–FITC and PI. (B) Dot plot representation of Annexin V–FITC and PI double stainings. The lower left quadrants of each panel show the viable DC (Annexin V− PI − ). The upper right quadrants contain the nonviable necrotic DC (Annexin V+ PI +). The lower right quadrants represent the apoptotic DC (Annexin V+ PI −). (C) Histogram representation of the percentages of intact viable, apoptotic, and necrotic DC among total DC present at various time of culture of either uninfected (□), Hallé-infected (•), or LYS-1–infected (○) DC.