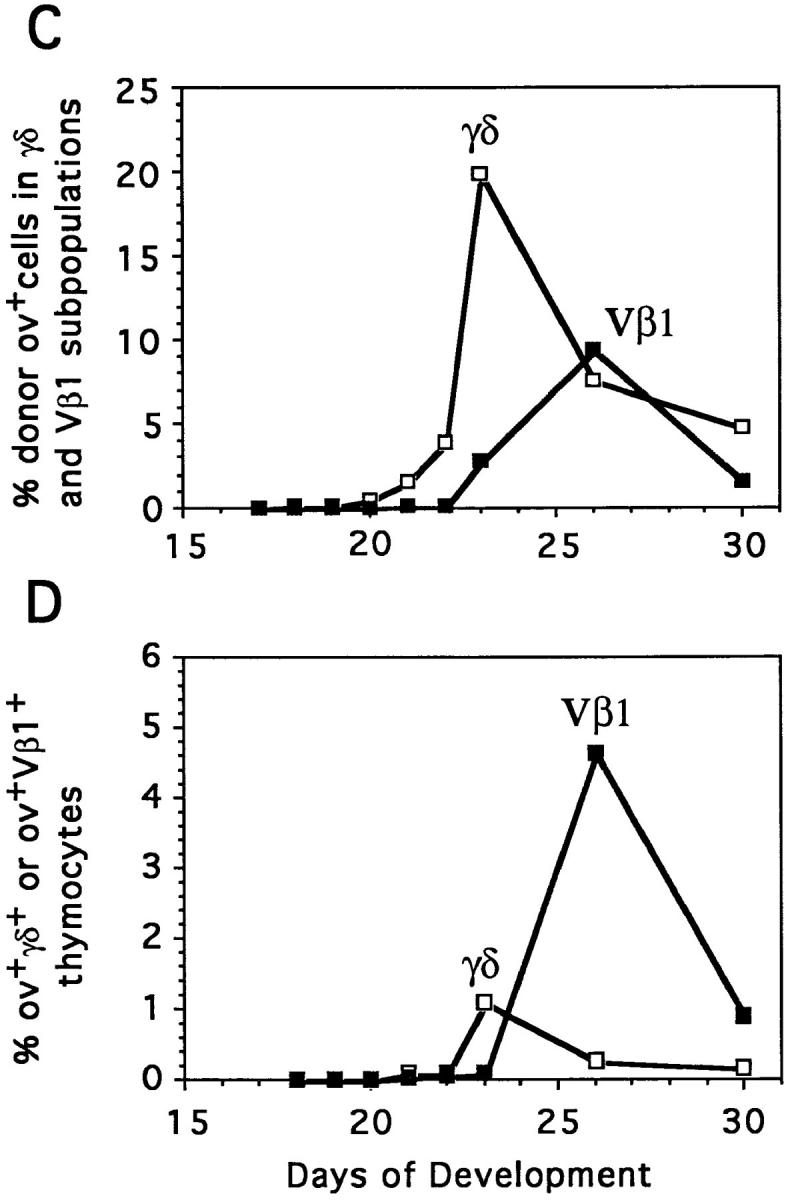
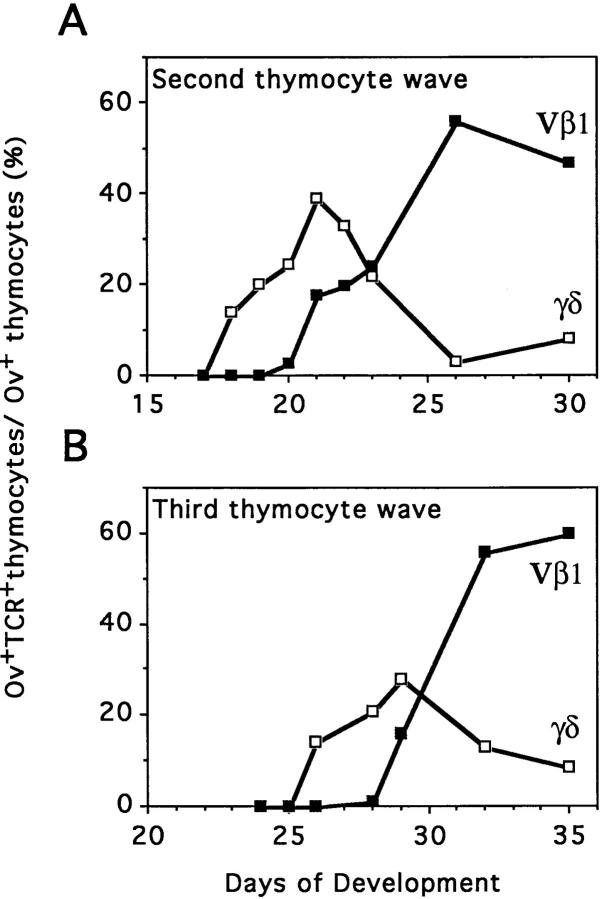
Figure 3.

Comparative differentiation kinetics of the second and third waves of thymocyte progenitors: appearance of TCR-γ/δ+ and TCR-α/β (Vβ1)+ T cell progeny. (A and B) Proportion of thymocytes expressing TCR-γ/δ or TCR-α/β (Vβ1) among donor ov+ thymocytes was determined by immunofluorescence flow cytometry. Each point corresponds to the mean value for three to five animals in four independent experiments. The differentiation of second wave T cell progenitors was analyzed by adoptive transfer of E13 H.B19ov+ bone marrow into E13 H.B19ov− embryos, and for analysis of the third wave, E18 H.B19ov+ bone marrow cells were injected into E18 H.B19ov− embryos (injections of 2.0 × 10⁷ cells). (C) Proportions of donor ov+ thymocytes that express TCR-γ/δ or TCR-α/β (Vβ1) during the differentiation of the second wave of progenitors. (D) Proportions of donor ov+ TCR-γ/δ+ and ov+ TCR-α/β (Vβ1)+ thymocytes derived from second wave thymocyte progenitors among the total thymocyte population in the recipient. The realistic efficiency of the γ/δ and Vβ1 T cell differentiation pathways followed by the progeny of the second wave of thymocyte progenitors can be estimated, since the areas under these curves are roughly proportional to the numbers of γ/δ and Vβ1 thymocytes produced by the donor second wave progenitors. This assessment suggests that the donor progenitors produced >15 times more α/β (Vβ1) than γ/δ thymocytes.

