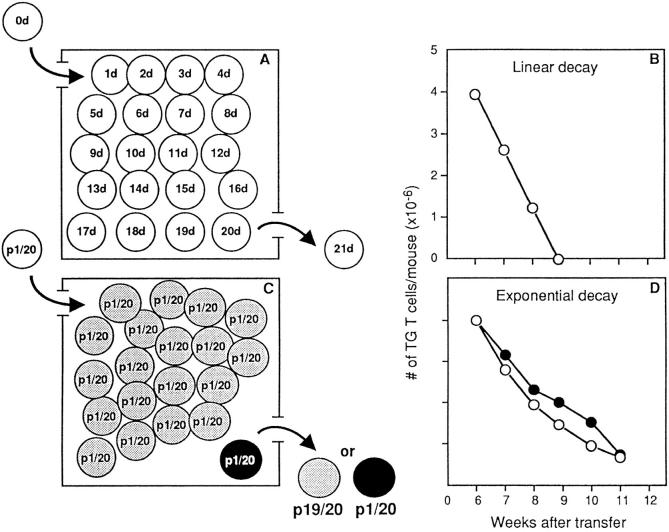
Figure 4.
The two hypotheses to explain the kinetics of substitution of naive T cells by thymus migrants. (Left) Boxes represent the periphery, where 20 different elements are pictured. Each element represents an individual cell. (Top) Substitution is conditioned by the age of the cell. (A) Each cell has a different age. Each day the younger cell (the thymus migrant) is incorporated in a peripheral pool, and the older cell dies. (B) Linear decay, calculated according to the formula Xt = X0 (1 − at). (Bottom) Substitution is cell age independent. (C) A large clone (19 elements), is shown in gray, and a small clone (1 element) in black. Each day, each cell has the same probability (1/20) of being replaced by a thymus migrant. The probability of replacing a gray cell will be 19 times higher than that of replacing the dark cell. (D) (Open circles) Exponential decay, calculated according to the formula X(t) = X0 (1 − a)t where Xt is absolute number of resident Tg cells as a function of time, X0 is absolute number of resident Tg cells at time 0, a is the ratio between the number of thymus migrants and the total number of resident T cells, and t is time in days. (Closed circles). Substitution of resident Tg cells by recent thymus migrants (experimental values). In B and D, the size of the T cell clones (y-axis) is shown on a linear scale.

