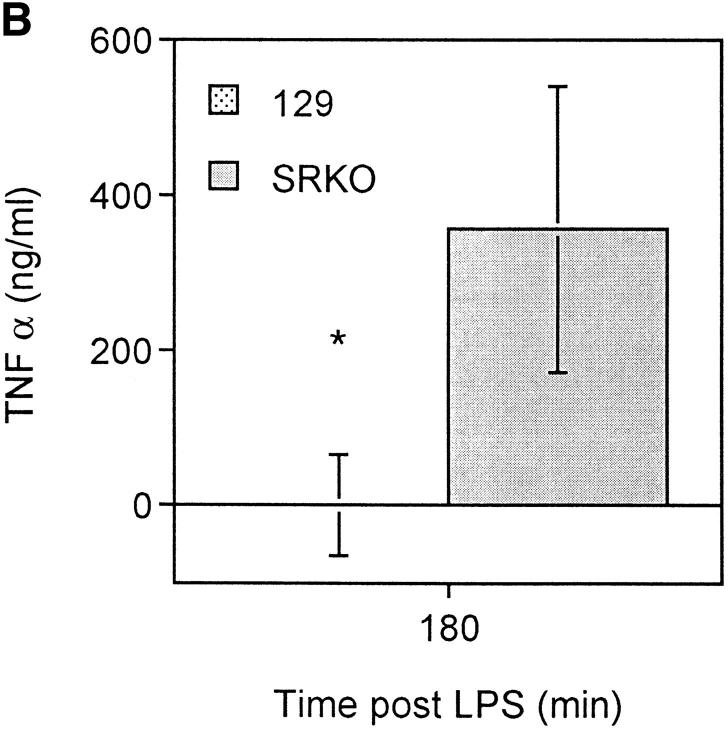
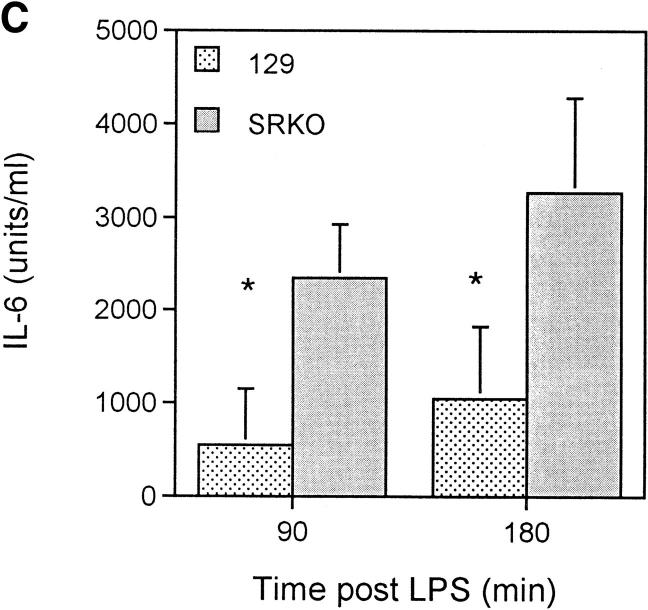
Figure 5.
Production of TNF-α after LPS challenge of SRKO and wild-type (129) mice. (A and B). SRKO and 129 mice were injected intraperitoneally with 107 CFU of BCG, or (C) inactivated C. parvum. At 14 d after infection, mice were injected with 10 μg of LPS intraperitoneally. The concentration of (A and C) TNF-α or (B) IL-6 in the serum was determined using capture ELISAs as described in Materials and Methods. Results at each time point represent the mean concentration ± SD of a group of five mice. *P <0.05 compared to SRKO serum cytokine levels.


