Figure 1.
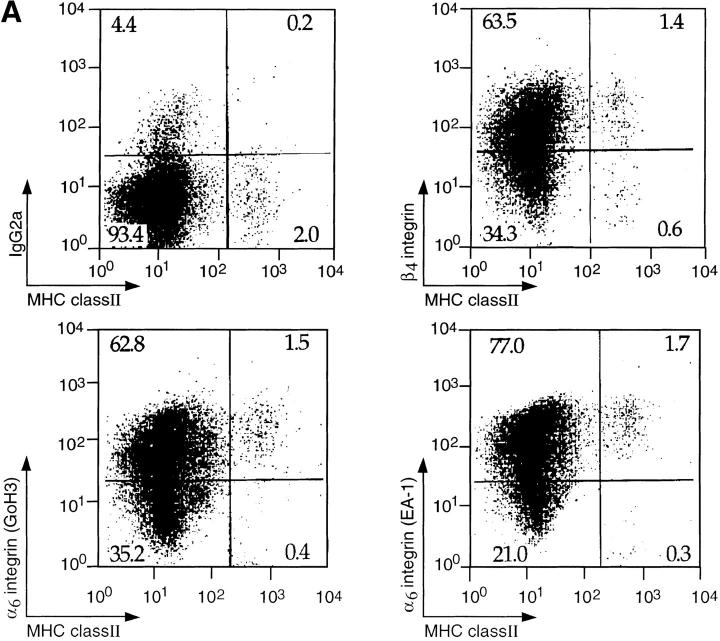
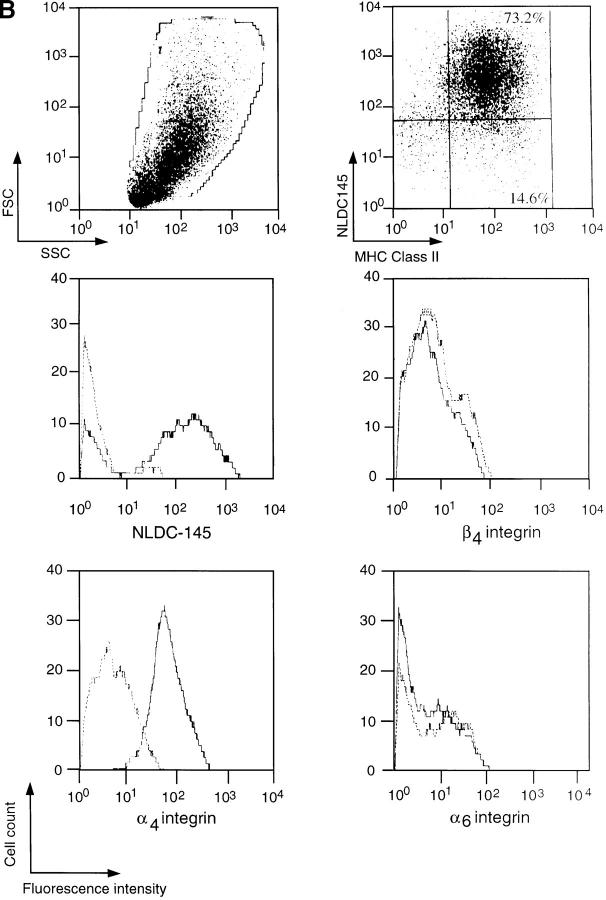
(A) Expression of α6 and β4 integrin subunits on LCs. Epidermal cell suspensions were prepared from the ears of naive mice by treatment with 0.5% trypsin and LCs were identified by the expression of MHC class II. The expression of integrin subunits was determined using antibodies to α6 (GoH3 or EA-1) or β4 subunits in comparison with an isotype-matched control antibody (IgG2a). Results show log fluorescence (0–104 channels) for MHC class II (x axis) and integrin subunit (y axis). The percentage of cells within each quadrant is given. (B) Expression of α4, α6, and β4 integrin subunits on lymph node DCs. DCs were enriched from the draining lymph nodes of oxazolone-treated mice by density gradient centrifugation on Metrizamide. DCs were distinguished from lymphocytes by forward scatter (FSC) versus side scatter (SSC) analysis and identified by high expression of MHC class II and dual staining for NLDC145 antigen. Histograms show the expression of α4, α6, and β4 integrin subunits on MHC class II positive DCs (solid lines) in comparison with isotype-matched control antibodies (dashed lines). The profiles show log fluorescence (0–104 channels) on the x axis and cell number (0–40) on the y axis.


