Figure 5.
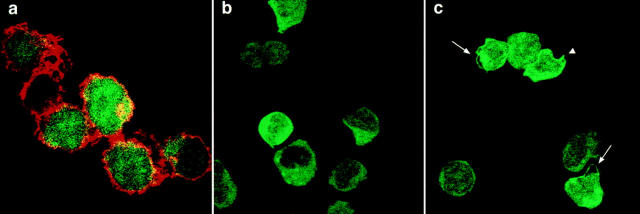
Intracellular location of ZAP-70 GFP in stably transfected P116 T cells, and its movement to the plasma membrane upon cellular activation. (a) Nuclear expression of ZAP-70 GFP in P116/2G1 cells is highlighted by the nucleolar exclusion pattern. Endogenous Lck, stained with anti-Lck and a rhodamine-coupled secondary mAb, is entirely extranuclear in all cells, and areas of yellow indicate the cytosolic colocalization of ZAP-70 GFP and Lck. (b and c) P116/2G1 cells were left untreated (b) or stimulated with F(ab′)2 of OKT3 for 2 min at 37°C (c). Arrows and arrowheads indicate peripheral rims and membrane blebs of ZAP-70 GFP, respectively (c).

