
Figure 4.
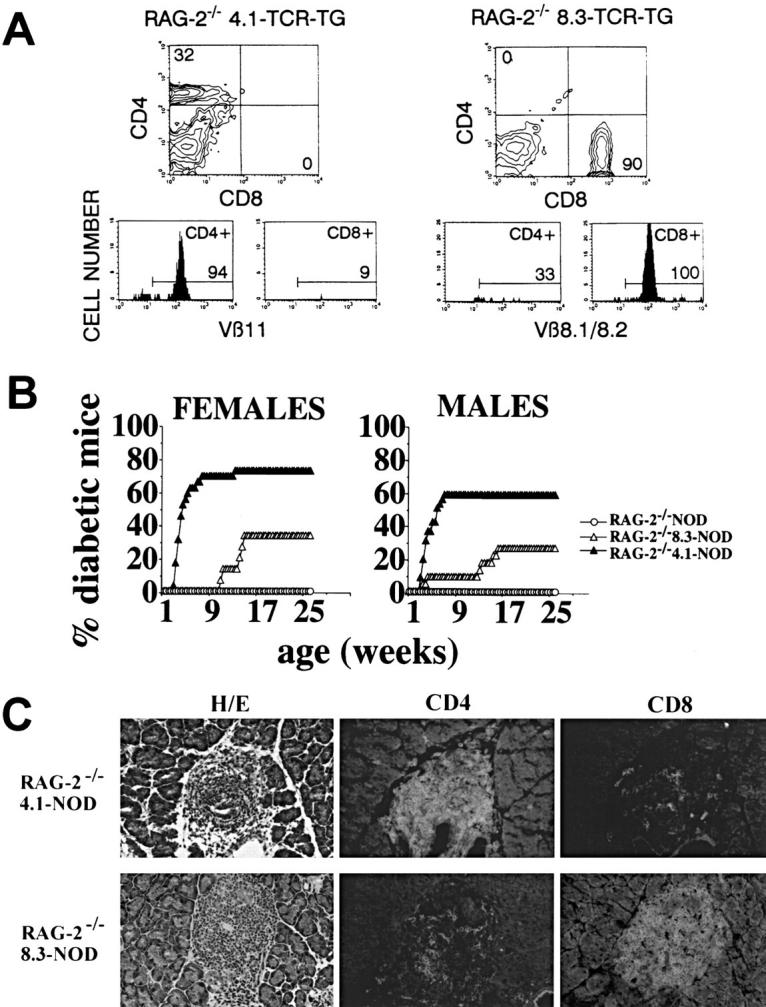
Diabetogenesis in TCR-transgenic RAG-2−/− NOD mice. (A) Flow cytometry profiles of lymph node cells from RAG-2−/− 4.1-NOD mice (left) and RAG-2−/− 8.3-NOD mice (right). (B) Incidence of diabetes in RAG-2−/− 4.1-NOD (n = 29 females and 35 males), RAG-2−/− 8.3-NOD (n = 12 females and 20 males), and RAG-2−/− NOD mice (n = 20 females and 20 males). The few cells of the opposite T cell subset that appear in the flow cytometry profiles of these mice are the result of nonspecific staining of dead cells. (C) Phenotype of islet-infiltrating T cells in RAG-2−/− 4.1-NOD and RAG-2−/− 8.3-NOD mice. Most of the few CD8+ T cells in RAG-2−/− 4.1-NOD mice, and the few CD4+ T cells in RAG-2−/− 8.3-NOD mice were the result of background staining, as they were also seen in anti–rat IgG-FITC–stained tissue.