
Figure 3.

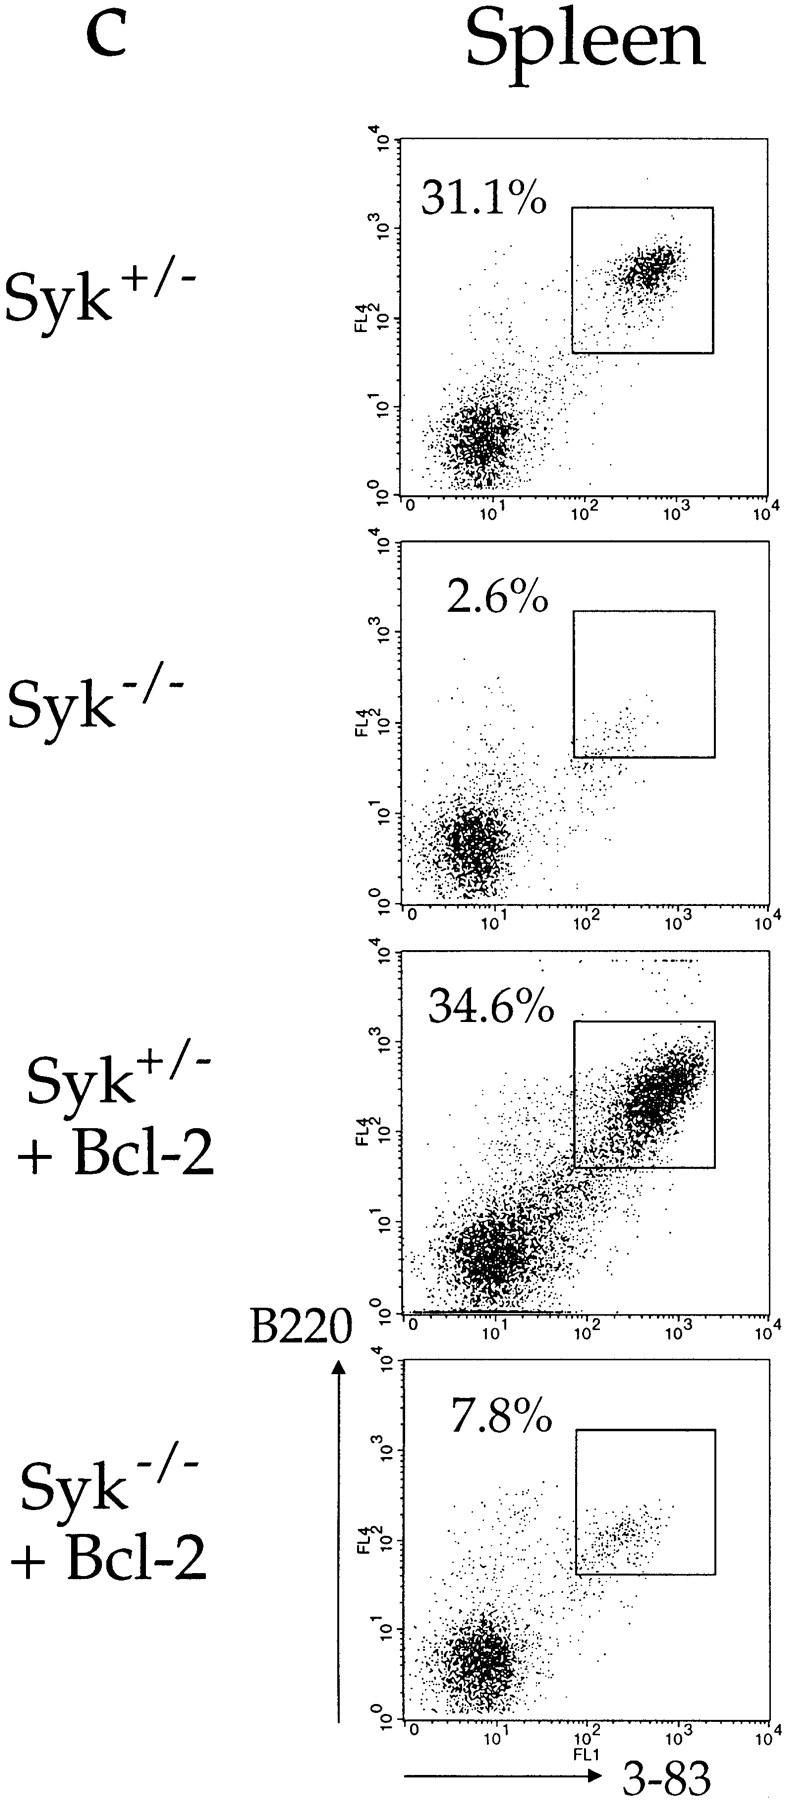

Positive selection of immature B cells. Flow cytometric analysis of cells from radiation chimeras reconstituted with liver cells from Syk +/−/3-83 (Syk+/−), Syk −/−/3-83 (Syk−/−), and Syk −/−/3-83/Bcl-2Tg (Syk−/− + Bcl-2) fetuses or from an adult Syk +/−/3-83/Bcl-2Tg (Syk+/− + Bcl-2) mouse. In separate experiments chimeras made with Syk +/−/3-83/Bcl-2Tg fetal liver gave essentially the same results as presented in this figure (data not shown). Chimeras made with Syk +/+/3-83 fetal liver gave results indistinguishable from Syk +/−/3-83 chimeras (data not shown). (a) The first column from the left shows the expression of B220 and the transgenic BCR (3-83) on bone marrow cells; B220+3-83+ cells are boxed and their fraction as a percentage of all lymphoid cells is shown. The second column shows the expression of IgMa and IgDa by B220+3-83+ cells with gating to show immature (IgM+IgD−), transitional (IgM+IgDlow), and mature (IgM+IgDhigh) B cells; the percentage for each gated population is expressed as a fraction of all lymphocytes. (b) The first column shows the gating on immature (B220low3-83low) cells that was used to generate the histograms of CD43 expression on B220+3-83+ bone marrow cells shown in the second column; percentages represent the fraction of gated immature B220low3-83low cells that are CD43−. (c) Expression of B220 and 3-83 in the spleen; B220+3-83+ cells are boxed and their fraction as a percentage of all lymphoid cells is shown. (d) Mean numbers ± SEM of B220+3-83+ cells in the bone marrow (per femur) and spleen are shown. In the marrow, these have been subdivided into immature (IgM+IgD−), transitional (IgM+IgDlow) and mature (IgM+IgDhigh) B cells using the gating shown in a. Data in (a–c) are representative of at least six mice of each genotype. Absolute cell numbers in the marrow were determined using eight Syk +/−/3-83 mice, six Syk −/−/3-83 mice, three Syk +/−/3-83/Bcl-2Tg mice, and four Syk −/−/3-83/Bcl-2Tg mice; data for the spleen cell numbers was determined using four Syk +/−/3-83 mice, four Syk −/−/3-83 mice, three Syk +/−/3-83/Bcl-2Tg mice, and two Syk −/−/3-83/Bcl-2Tg mice.