
Figure 4.
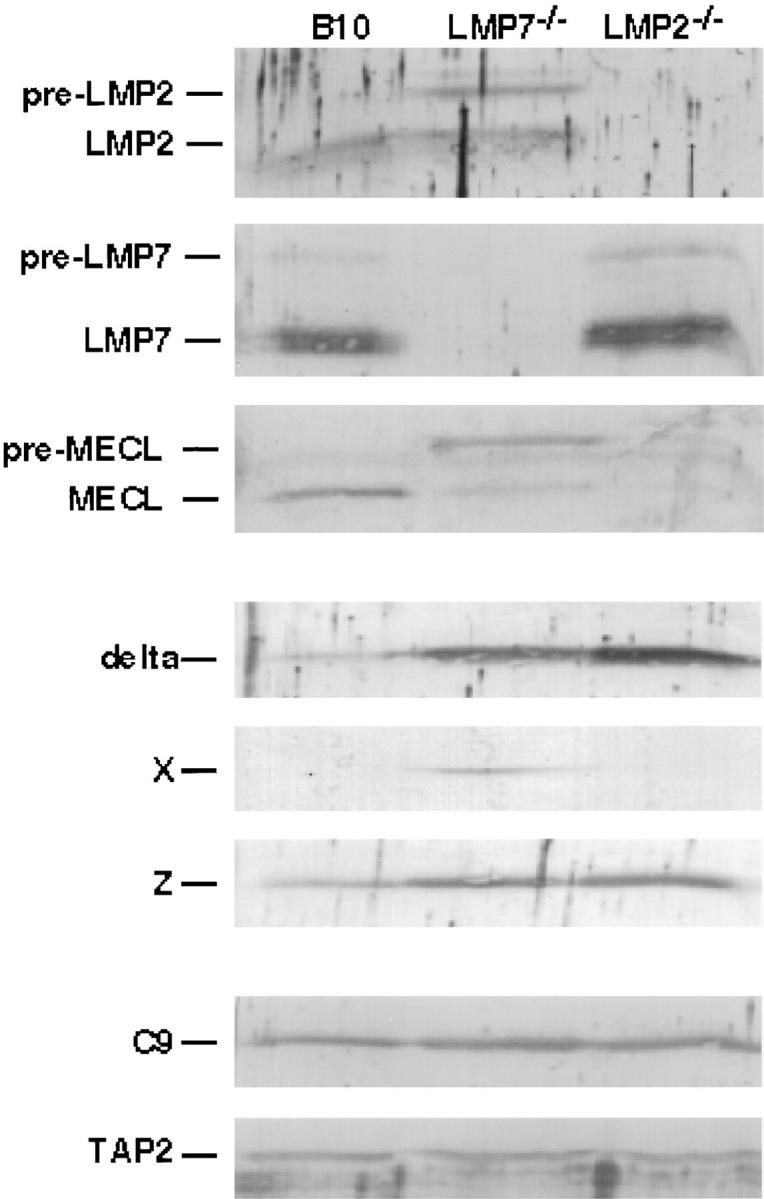
Relative levels of proteasome subunits in spleen cells from B10 (wild type), LMP7−/−, and LMP2−/− mice. Lysates of mouse spleen Con A–stimulated T cell blasts (1.5 × 10⁶/lane) were subjected to SDS-PAGE and specific proteasome subunits were visualized by immunoblotting. The C9 and TAP2 immunoblots demonstrate the relative amounts of proteasomes and total protein present in each sample.