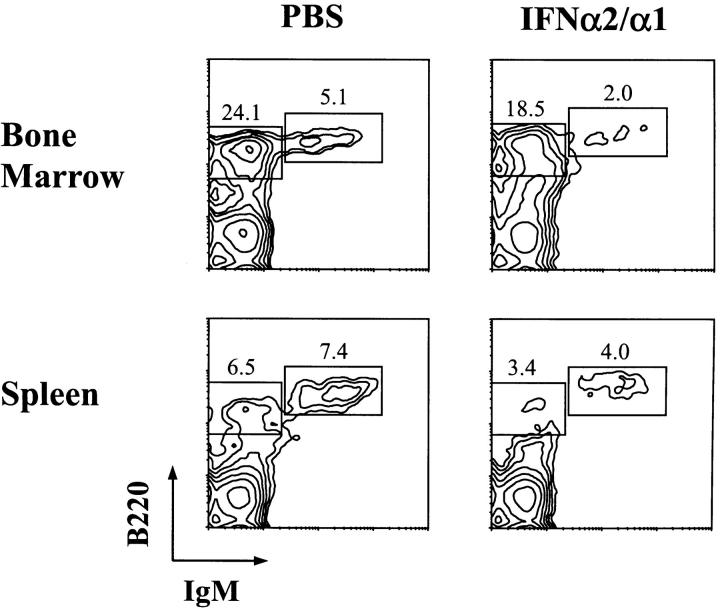
Figure 3.
Immunofluorescence profile analysis of B lineage cells in the bone marrow and spleen of PBS- and IFN-α2/α1–treated mice. Cells were stained with FITC-conjugated anti-μ and Cy-chrome–labeled anti-B220 and the immunocytometric analysis was limited to cells with the forward and side light scattering characteristics of lymphocytes. Percentages of IgM−B220+ and IgM+B220+ cells in the boxed areas are indicated.

