
Figure 4.
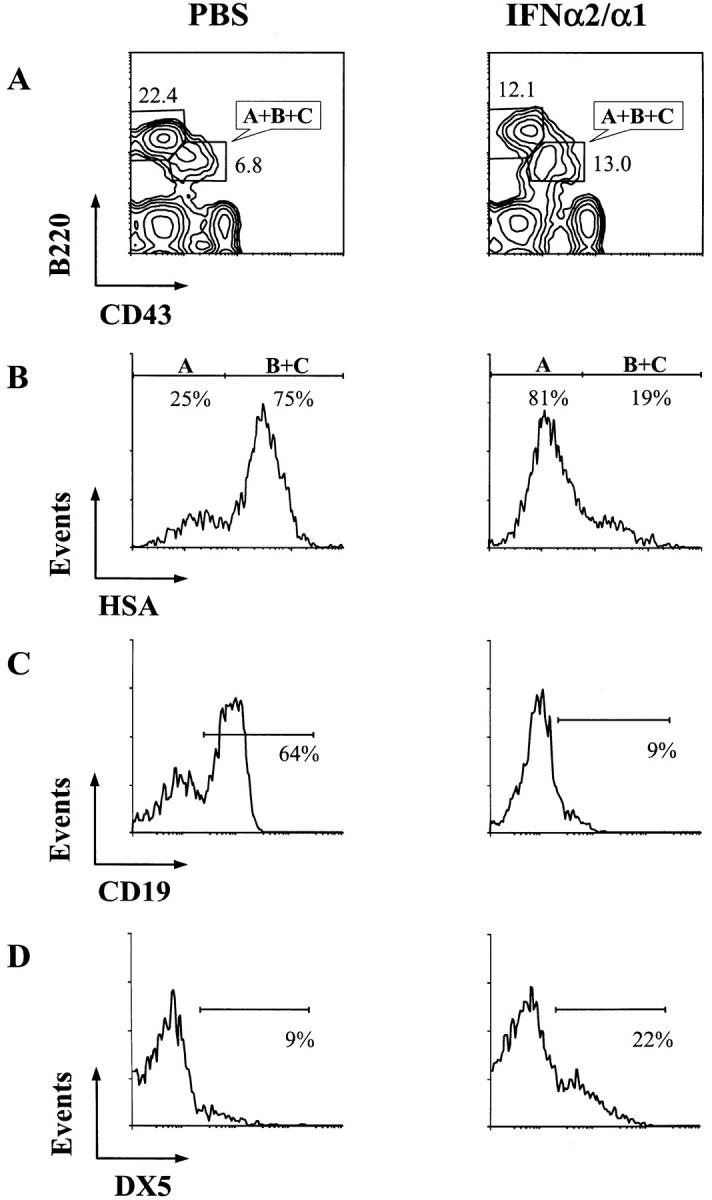
Immunofluorescence profile analysis of B lineage cells in the bone marrow of PBS- and IFN-α2/α1–treated mice. Bone marrow cells were stained with the CD43, HSA, CD19, DX5, and B220 antibodies. (A) Lymphocyte gates were set for forward and side light scattering, and the CD43−B220+ and CD43+B220+ (fractions A, B, and C) subpopulations are indicated as percentages of cells in the two boxes. (B) Fraction A is distinguished from fractions B and C in the CD43+B220+ subpopulation of cells by HSA expression. Fraction A cells were further analyzed for their expression of CD19 as a B lineage marker (C) and of DX5 as an NK lineage marker (D).