
Figure 2.
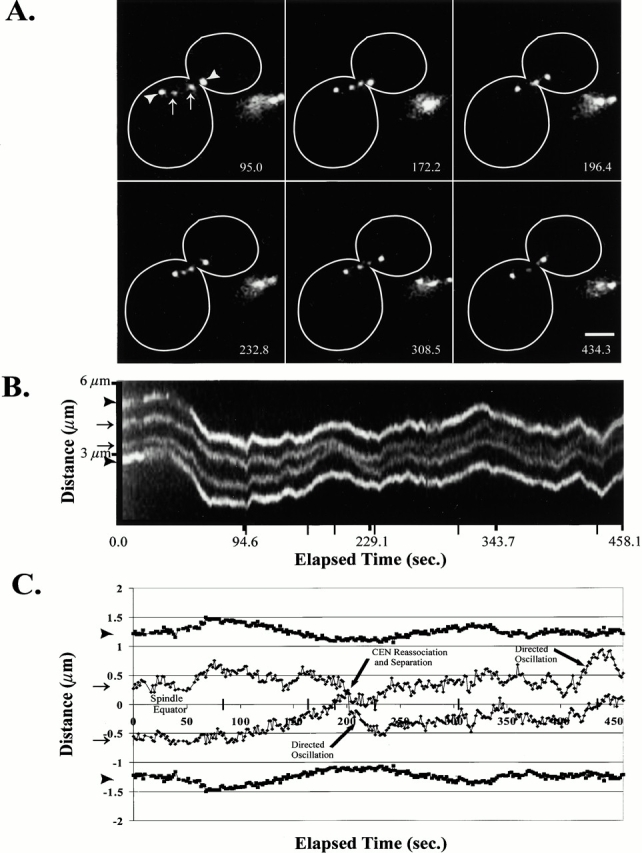
Centromere proximal spots exhibited dynamic separation and oscillations along the preanaphase mitotic spindle. The lacO marker was integrated ∼1.1 kb from CEN11 with Spc72–GFP-labeled spindle pole bodies. (A) Selected frames of an ∼7.5-min single-plane time-lapse. (B) A kymograph sequence of the entire time-lapse collected at ∼0.9-s intervals. Narrow tick marks indicate corresponding time points to the above selected frames. (C) Graphical plot of the above time course. In both A and B, arrowheads denote the spindle pole bodies, and arrows define the centromere proximal chromosome spots. Elapsed time provided in seconds. Bar, 2 μm.