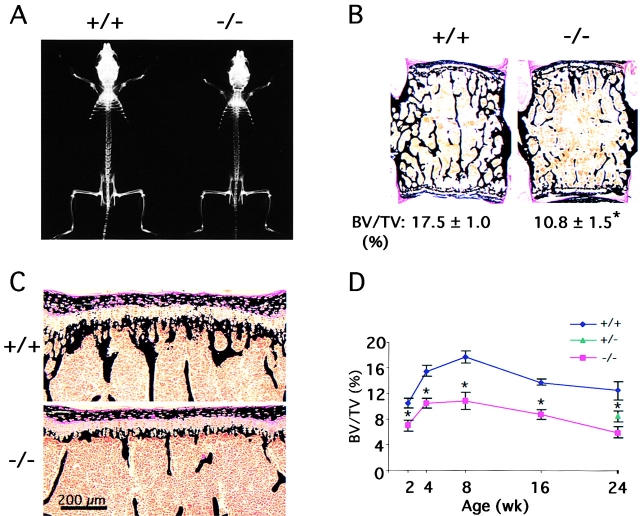
Figure 3.
Low bone mass in Lrp5 − / − mice. (A) Radiograph of the whole body of 2 mo-old wild-type and Lrp5 − / − mice showing decreased lucency of the entire Lrp5 − / − skeleton. (B) Histological analysis of vertebrae from 2-mo-old wild-type and Lrp5 − / − mice showing low bone mass in the mutant mice. (C) Histological analysis of vertebrae from 2-wk-old wild-type and Lrp5 − / − mice showing a decreased number of trabeculae in the primary spongiosa of Lrp5 − / − mice. (D) Lrp5 − / − mice have a lower bone mass throughout life. Green triangle indicates a significantly lower bone mass in Lrp5 +/− mice. Asterisks indicate a statistically significant difference between two groups of mice (P < 0.05). Error bars represent SD.

