
Figure 5.
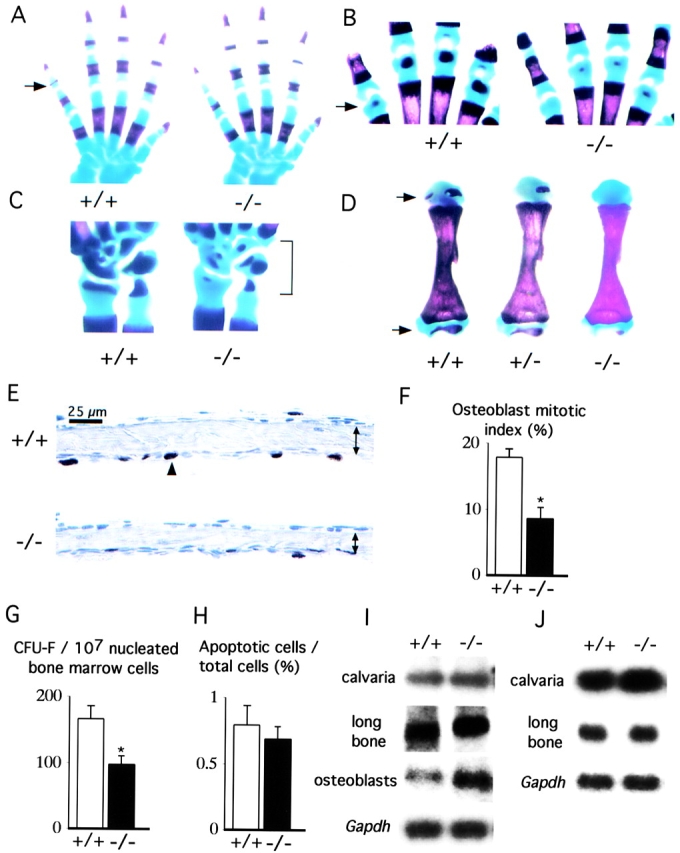
Postnatal onset of the bone phenotype in Lrp5 − / − mice. (A) Subtle delay of fifth middle phalanx ossification in newborn Lrp5 − / − mice. (B) Delayed ossification of metacarpals. (C) Carpals (bracket). (D) Humeri in 4-d-old Lrp5 − / − mice. Arrows in A, B, and D indicate ossification centers. A subtle delay was also evident in 44% (8/18) of heterozygote mice (D, middle). (E) Sections of calvaria from 4-d-old mice showing a decreased number of BrdU-positive cells (arrowhead) in Lrp5 − / − mice compared with wild-type littermates. Double-headed arrows indicate the greater thickness of wild-type calvarium. (F) Osteoblast mitotic index (percentage of BrdU-positive cells per total cell number) in wild-type and Lrp5 − / − mice (n = 8 per genotype). (G) Quantification of alkaline phosphatase positive stromal cell progenitors (CFU-F) in the bone marrow of wild-type and Lrp5 − / − mice (n = 9 mice per genotype). (H) Quantification of apoptotic cells by TUNEL assay in wild-type and Lrp5 − / − mice (n = 5 per genotype). (I) Northern blot analysis of Cbfa1 expression in wild-type and Lrp5 − / − calvaria, long bones and primary osteoblasts. (J) Northern blot analysis of Osteocalcin expression in wild-type and Lrp5 − / − calvaria and long bones. (I and J) Gapdh expression level was used as a loading control; results are representative of three samples (n = 3 mice per sample). Asterisks indicate a statistically significant difference between two groups of mice (P < 0.05). Error bars represent SD.