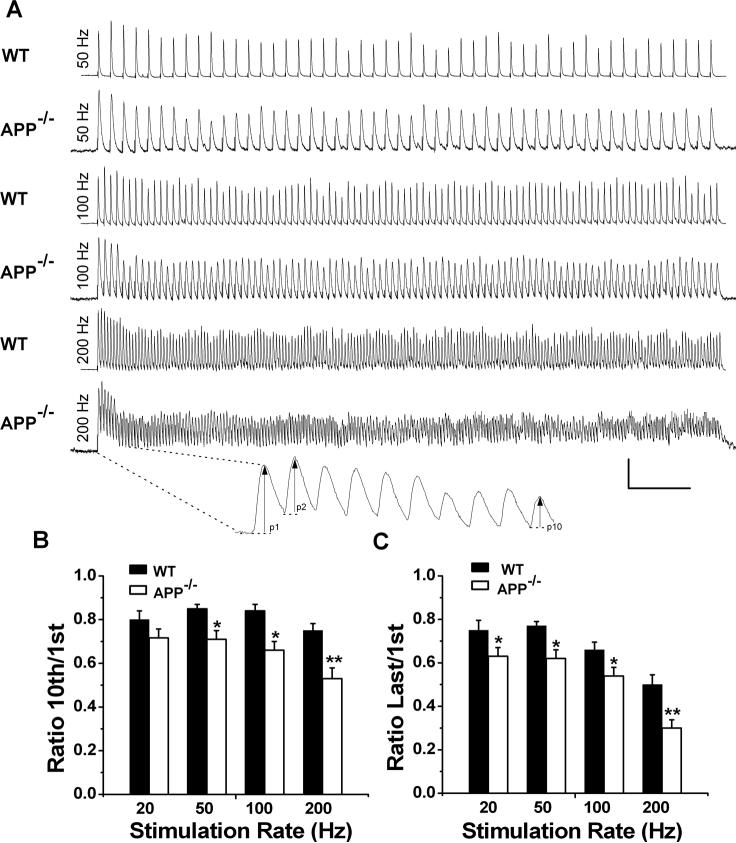
Figure 2.
Increased depression of synaptic transmission in APP−/− NMJs at high-frequency stimulation. A. Representative traces showing EPP depression elicited by 20, 50, 100 and 200 Hz nerve stimulation at WT or APP−/− endplates. Scale: 5 mV/100 msec. Enlarged trace under 200 Hz recording shows the amplitude values. B and C. Ratios of EPP at 10th to first (B) or the end of train to first (C) stimulus at 20, 50, 100 and 200 Hz. N=12−14 at each frequency for both genotypes. *p<0.05; **p<0.005.

