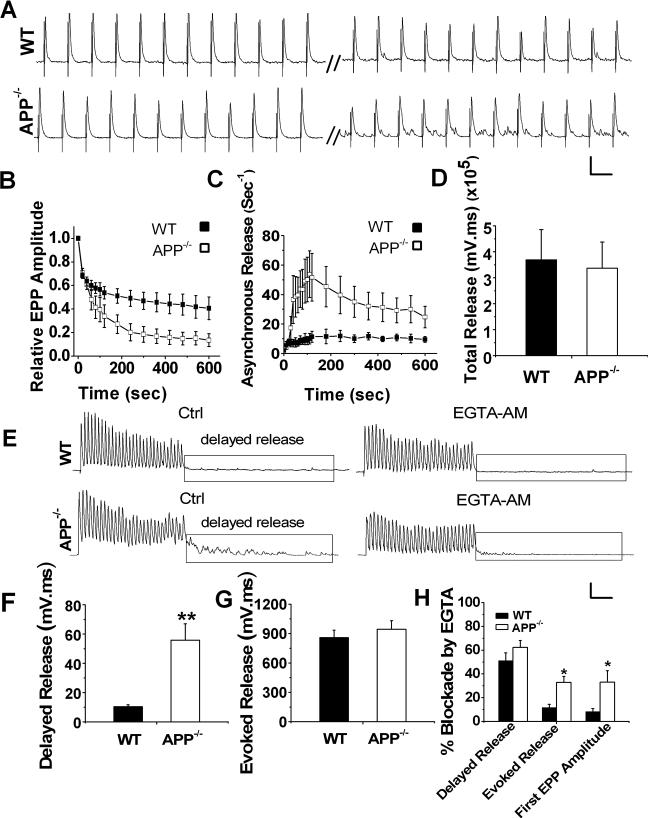
Figure 4.
Reduced synchronous but increased asynchronous release in APP−/− endplates during repetitive stimulation. A. Representative traces from WT and littermate APP−/− NMJ in response to 10 min, 30 Hz stimulation (scale: 5 mV/30 ms). B. Average EPP amplitude during 10 min 30 Hz train normalized to the first response. Each point represents average EPP amplitude of 1 sec responses. C. Increased frequency of asynchronous release in APP−/− NMJs during the train. D. Bar graphs showing identical total release, which is the integral to 10 min, 30 Hz train, in both genotypes. (WT, N=7; APP−/−, N=9). E. Representative traces of WT and APP−/− NMJs in response to 30 stimuli applied at 200 Hz before (Ctrl) and after addition of 0.1 mM EGTA-AM (Scale: 5 mV/30 msec). F and G. Significantly increased delayed release (F), but similar evoked release (G) in APP−/− NMJs in the absence of EGTA-AM (N is 23 and 27 for WT and APP−/−, respectively). H. Blockade of evoked, delayed release and amplitude of first EPPs by EGTA-AM in WT (6 pairs, 6 muscles) and APP−/− NMJs (5 pairs, 5 muscles). Error bars indicate SEM. *p<0.05, **p<0.005.

