
Figure 8.
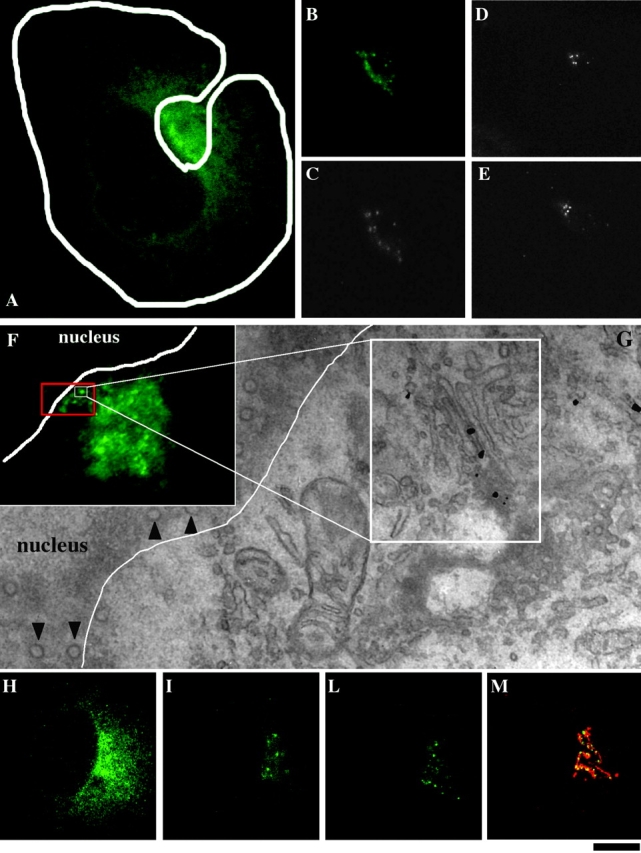
Dynamic behavior of VSVG-GFP during intra-Golgi transport. Cell were transfected with VSVG–GFP, placed on glass bottom microwell dishes with coordinated grids, subjected to the small-pulse protocol, and studied, after releasing the 15°C block, by laser scanning confocal microscope and time-lapse analysis. (A) 4 min after the shift, the Golgi spots containing VSVG–GFP in the central Golgi area were masked by the high ER background. (b and c) Repeated bleaching of the whole cell (except the Golgi area, delineated) removed the ER background and made the spotty pattern of the VSVG in the Golgi zone more evident. (d and e) Half of the Golgi area was bleached and observed 1 min (D) and 5 min (E) after bleaching. No fluorescence recovery was observed. (Video 1, available at http://www.jcb.org/cgi/content/full/jcb.200108073/DC1). (f and g) This cell was fixed 7 min after releasing the 15°C block and prepared for correlative video light EM using the nanogold gold enhancement method. The region at the center of the white square in (F) was analyzed (it corresponds to the square is the area enlarged in G). As can be seen in G, the spot represents a stack containing VSVG–GFP in a central cisterna (large white square) Arrowheads indicate nuclear pores. (H–M) Cells were treated as for the experiment in panels B and C and observed at 4 min; (H) Image before bleaching; (I) 7 min; (L) 11 min after releasing the temperature block. At 11 min (when some of the spots were starting to leave the Golgi area) it was fixed an stained for TGN46 (red) and VSVG (green) (M). Many of the spots colocalize with the ribbon, whereas others are probably moving out. Bar: (A–E and H–M) 15 μm; (F) 8 μm; (G) 300 nm.