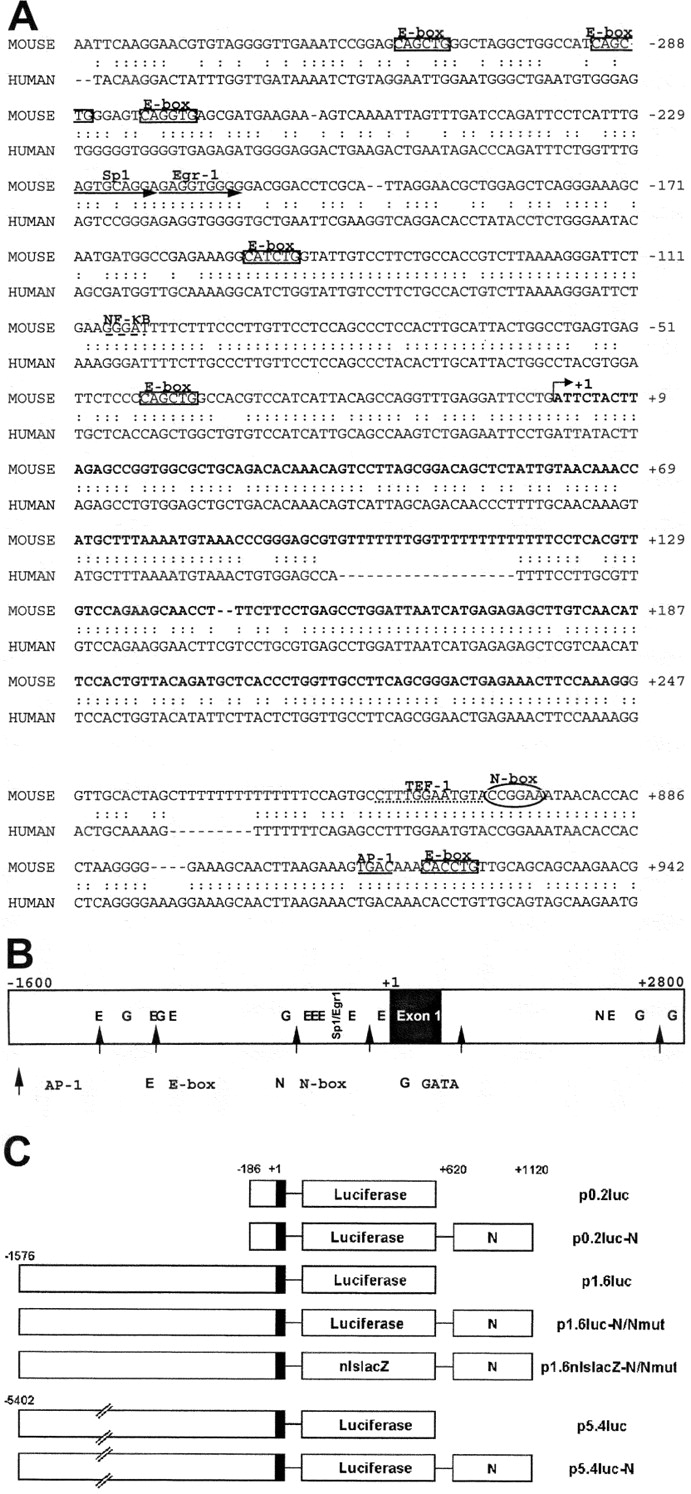
Figure 1.

Regulatory sequences of the nsk2 gene. (A) Sequence comparison of the mouse (top) and the human (bottom) promoter regions with exon1 and part of the first intron of the nsk2/musk gene. The putative transcription start determined by 5′ RACE PCR is indicated as +1 for the mouse sequence. Boxes indicate E-boxes, the oval shows the N-box, black arrows show Sp1/Egr-1 putative binding sites, the large dotted line indicates a putative NF-κB binding site, the small dotted line indicates a putative TEF-1 binding site, and a putative AP-1 binding site is underlined. (B) Schematic representation of a larger region upstream and downstream the first exon. Potential binding sites for transcription factors are indicated. Prediction of the transcription factor binding site have been generated with the MatInspector software from Genomatix. (C) Schematic diagram of the different constructs used in vitro or in vivo experiments with either the luciferase gene or the lacZ gene as a reporter.
