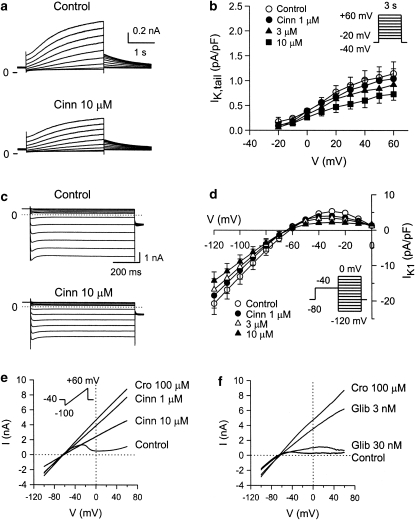
Figure 6.
(a) Effects of cinnamophilin on IK in guinea-pig ventricular myocytes. Superimposed current traces obtained during 3 s depolarizing pulses to potentials ranging from −20 to +60 mV in 10 mV steps applied from a holding potential of –40 mV before (control) and after 5 min exposure to 10 μM cinnamophilin. (b) I–V relationships for IK tail currents recorded under control conditions and during exposure to increasing concentrations of cinnamophilin. Data are means±s.e.mean (n=9). (c) Effects of cinnamophilin on IK1 in ventricular myocytes. Superimposed current traces in the absence and after 5 min of exposure to 10 μM cinnamophilin were serially elicited (from 0 to –120 mV for 800 ms in 10 mV steps) after a prepulse of –40 mV. (d) I–V curves of IK1 in the absence and presence of 1, 3, and 10 μM cinnamophilin. Data are means±s.e.mean (n=8). (e) and (f) Effects of cinnamophilin (Cinn) or glibenclamide (Glib) on whole-cell IK,ATP induced by 100 μM cromakalim (Cro) in ventricular myocytes, respectively. The quasi steady-state currents were evoked by a 9-s long voltage ramp from −100 to +60 mV (holding potential=–40 mV). The voltage protocol is shown in the inset of (e). IK, delayed rectifier K+ current; IK1, inward rectifier K+ current; IK,ATP, ATP-sensitive K+ current; I–V, current–voltage.

