
Figure 3.
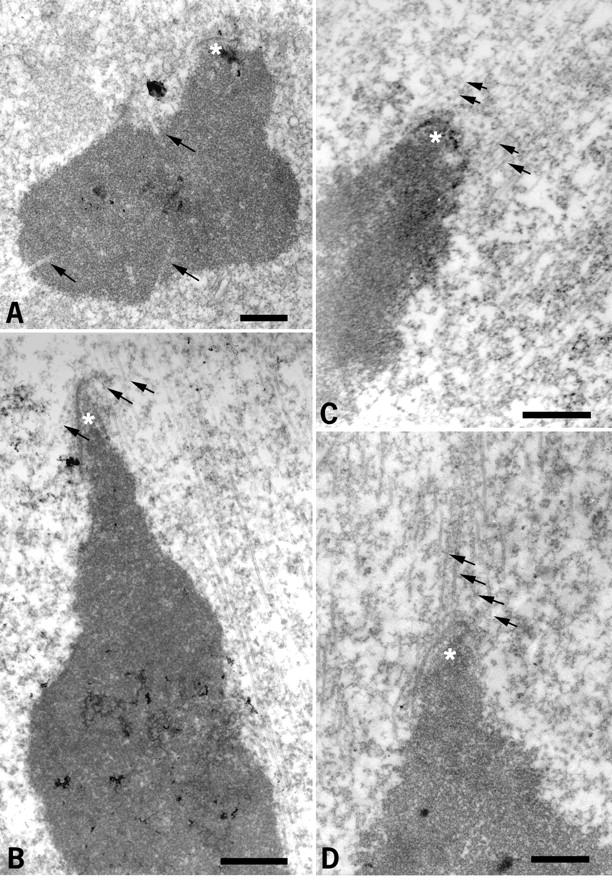
Study of chromatin and kinetochore–microtubule interactions during the first meiotic M phase by EM. (A) 2 h after GVBD. (B) 6 h after GVBD. (C and D) 8 h after GVBD. Asterisks, kinetochores; arrows, microtubules. Bars, 1 μm.
Official websites use .gov
A
.gov website belongs to an official
government organization in the United States.
Secure .gov websites use HTTPS
A lock (
) or https:// means you've safely
connected to the .gov website. Share sensitive
information only on official, secure websites.
Study of chromatin and kinetochore–microtubule interactions during the first meiotic M phase by EM. (A) 2 h after GVBD. (B) 6 h after GVBD. (C and D) 8 h after GVBD. Asterisks, kinetochores; arrows, microtubules. Bars, 1 μm.