
Figure 4.
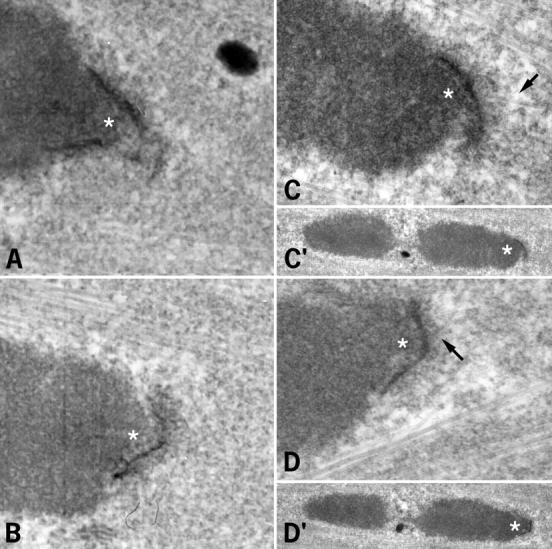
Study of kinetochore–microtubule end interactions 6 and 7 h after GVBD by EM. (A and B) 6 h after GVBD. (C and D) 7 h after GVBD. C and D correspond to two sections of the same kinetochore (C′ and D′ are the corresponding low magnification images). Asterisks, kinetochores; arrows, microtubules. Bar, 1 μm.