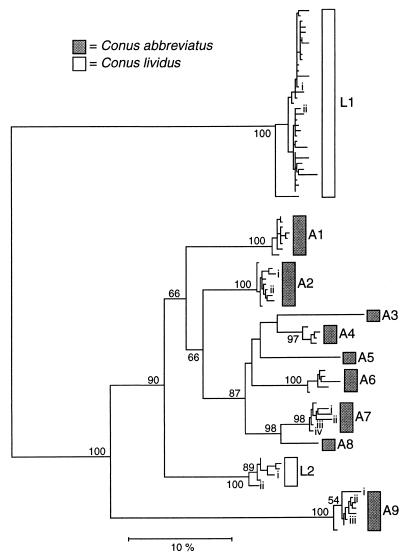
Figure 1.
Neighbor-joining tree reconstructed from Kimura two-parameter distances computed from comparisons of entire conotoxin sequences (including 3′ untranslated regions). Bootstrap values >50% are indicated on branches. Roman numerals labeling branches within groups identify the representative sequences used in Dn and Ds analyses and Tables 1 and 2. Total numbers of sequences in each group from each individual: A1, n1 = 6, n2 = 9; A2, n1 = 19, n2 = 14; A3, n1 = 1, n2 = 0; A4, n1 = 5, n2 = 5; A5, n1 = 1, n2 = 0; A6, n1 = 5, n2 = 5; A7, n1 = 9, n2 = 2; A8, n1 = 1, n2 = 0; A9, n1 = 4, n2 = 14; L1, n1 = 26, n2 = 43; L2, n1 = 11, n2 = 0.

