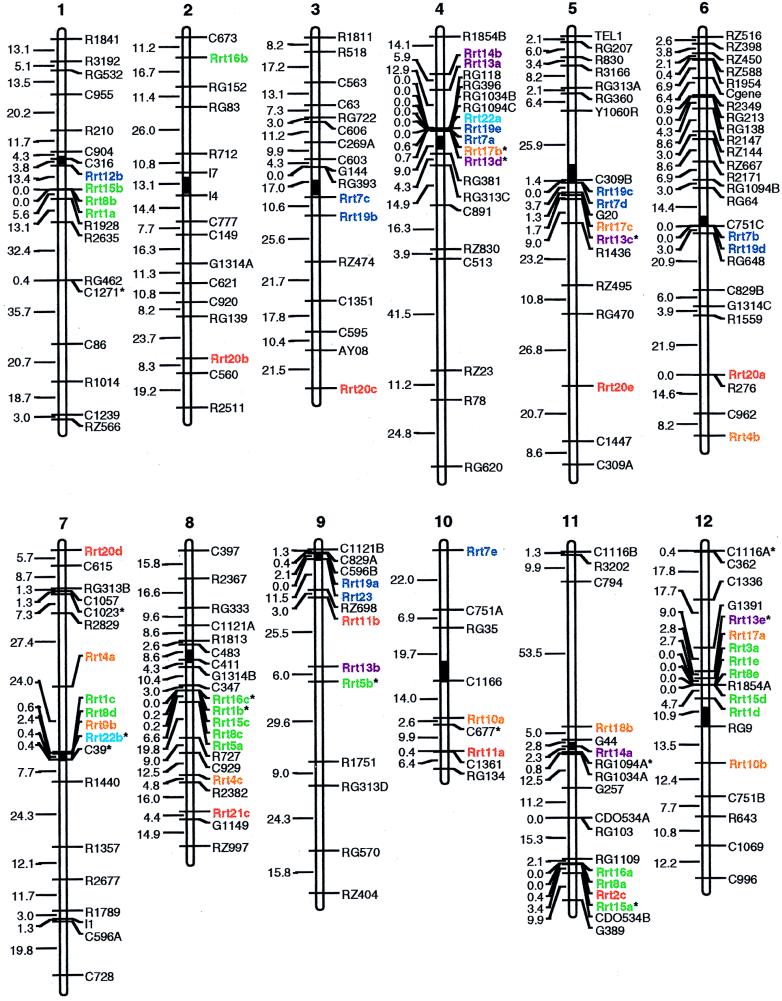
Figure 1.
Distribution of copia-like retrotransposon loci (Rrt) on the molecular-linkage map of rice. The retroelement loci appearing in the same color belong to the same subgroup. A lower case letter following a retrotransposon locus indicates that multiple copies were detected by the same clone. All of the loci were assigned by using a logarithm of odds score of 3.0, except those marked with asterisks (∗), which were assigned by using a logarithm of odds score of 2.0. The map distances are presented in centimorgans to the left of the chromosomes. The solid black bars represent the relative locations of the centromeres according to the results of Singh et al. (30) with reference to the information from three published molecular-linkage maps (24, 26, 34). The orientation of the chromosomes was presented according to Singh et al. (30) with the short arm placed on top.

