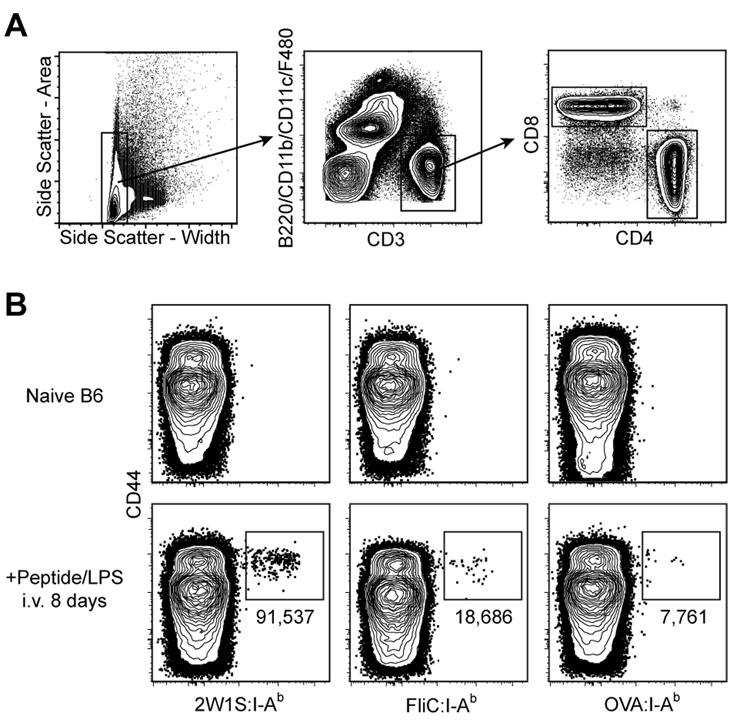
Figure 1. Primary immune responses of naive CD4+ T cells vary with respect to pMHC specificity.
A, Flow cytometry gates used in all figures to identify T cells from total spleen and lymph node cells: side scatter-widthlow (left plot); CD3+, non-T cell lineage- (middle plot); and either CD4+ or CD8+ (right plot). B, Where indicated, B6 mice were injected i.v. with 50 µg of the indicated peptide plus 5 µg LPS. Eight days later, spleen and lymph node cells were harvested and stained with the indicated tetramer. Representative contour plots of CD44 versus the indicated tetramers are shown for non-T cell lineage-, CD3+, CD4+ events gated from 106 total collected events. The total number of cells for each individual mouse shown is indicated below the relevant gate. Mean values ± S.D. were 2W1S:115,000 ± 40,000; FliC: 23,000 ± 20,000; OVA: 7,000 ± 3,000 (n=4 per group).

