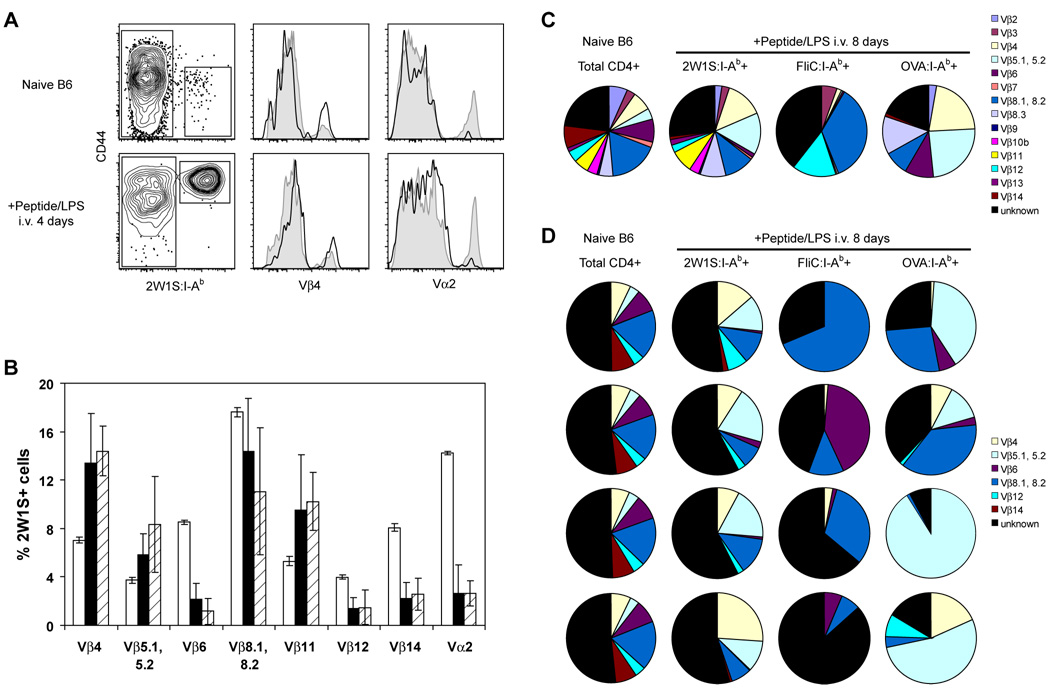
Figure 6. Naive CD4+ T cell population diversity is related to population size.
A, Total lymph node and spleen cells from naive B6 mice (top) or B6 mice injected i.v. with 50 µg 2W1S peptide plus 5 µg LPS 4 days earlier (bottom) were stained with antibodies to TCR Vβ4 and Vα2. 2W1S:I-Ab- and 2W1S:I-Ab+ gated events are represented in histograms by shaded profiles and solid lines, respectively. B, TCR Vβ and Vα gene segment usage in total CD4+ T cells from naive mice (unfilled bars), or 2W1S:I-Ab+ CD4+ T cells from naive mice (filled bars) or mice injected i.v. with 50 µg 2W1S peptide plus 5 µg LPS 4 days earlier (hatched bars). Data are mean values ± S.D. from 4∓8 mice per group. C, Usage profile for TCR Vβ gene segments in total CD4+ T cells from naive B6 mice or tetramer+ CD4+ T cells from B6 mice injected i.v. with 50 µg of the indicated peptide plus 5 µg LPS 8 days earlier. Data are values from pooled samples taken from 4–10 mice per group, or D, samples taken from 4 individual mice per group.

