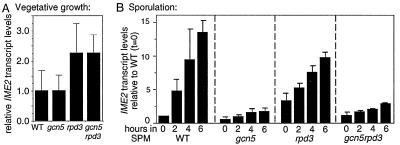
Figure 4.
IME2 transcript levels in vegetative and meiotic WT cells (NKY3222) and gcn5–21 (NKY3221), rpd3Δ (NKY3227), and gcn5–21 rpd3Δ (NKY3228) mutant cells. (A) Average IME2 transcript levels from Northern blot analysis (not shown) of three independent cultures (± SD) normalized to rRNA levels. (B) Average IME2 transcript levels from Northern blot analysis (not shown) of two independent meiotic time course experiments normalized to rRNA levels.

