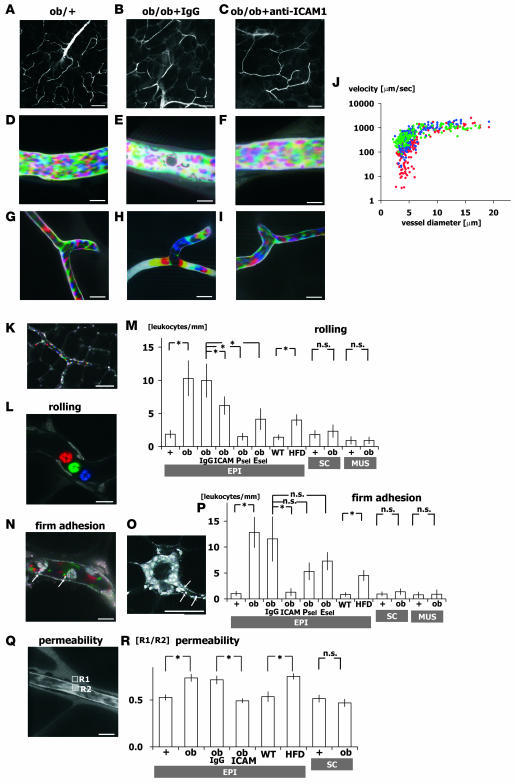
Figure 2. Abnormal leukocyte-EC-platelet interactions in obese adipose tissue revealed by intravital fluorescence microscopy.
One-shot (A–C and O) and time-lapse images (D–I, K, L, and N) obtained by intravital fluorescence microscopy at the postcapillary venule (D–F) and capillary (G–I) levels in adipose tissue from ob/+, IgG-treated ob/ob, and anti–ICAM-1–treated ob/ob mice as indicated as well as untreated ob/ob mice (K, L, N, O, and Q). Time-lapse images were reconstructed in red-green-blue order from 3 sequential images obtained at 30-ms intervals from Supplemental Movies 1–6 (D–I, respectively). Following FITC-dextran injection (MW 150,000), blood cells were negatively visualized in cyan-magenta-yellow order. Erythrocyte, leukocyte, and platelet cell dynamics were visualized at high spatiotemporal resolutions. Blood cell type was determined from the cell size. Where indicated, anti–ICAM-1, anti–E-selectin (Esel), anti–P-selectin (Psel), and normal rat IgG was injected intravenously prior to observation. Note the firmly adherent leukocytes and platelets on the vascular wall and the low hematocrit within the postcapillary venules of ob/ob mice (E). (J) Relationship between blood flow velocity and vascular diameter in adipose tissue from ob/+ (blue), IgG-treated ob/ob (red), and anti–ICAM-1–treated ob/ob (green) mice. Blood flow velocity at the capillary level (<8 μm) was significantly slower in ob/ob than ob/+ mice, but was increased to ob/+ levels by anti–ICAM-1 treatment (n = 5, total 100 vessels/genotype). (K–P) Nuclear staining with acridine orange for specific visualization of leukocyte dynamics. Time-lapse images were reconstructed in red-green-blue order from 3 sequential images obtained at 90-ms intervals from Supplemental Movies 7 (L) and 8 (N), and enabled leukocyte rolling and firm adhesion were visualized. FITC-conjugated anti-CD41 antibody was used to visualize platelet dynamics (N). Number of rolling (M) and firmly attached (P) leukocytes per postcapillary venule length (leukocytes/mm; n = 5, total 50 vessels/genotype) and in epididymal adipose tissue from lean C57BL/6 mice fed normal chow (WT) and high-fat diet–induced obese mice (HFD). In ob/ob mice, the number of rolling/adherent leukocytes significantly increased in epididymal fat (EPI), but not in inguinal subcutaneous fat (SC) or quadriceps skeletal muscle (MUS). (Q and R) Vascular permeability of epididymal and subcutaneous adipose tissue analyzed using FITC-dextran (MW 4,000). Fluorescence intensities within the vessel (R2) and stromal space (R1) were measured, and R1/R2 ratio was used to assess the level of extravasation of FITC-dextran. Permeability increased in obese epididymal adipose tissue from ob/ob and high-fat diet–fed mice, but was normalized by anti–ICAM-1 (n = 3, total 60 points from 20 fields/genotype). Scale bars: 100 μm (A–C and K), 50 μm (O), 10 μm (D–I, L, N, and Q). *P < 0.05.

