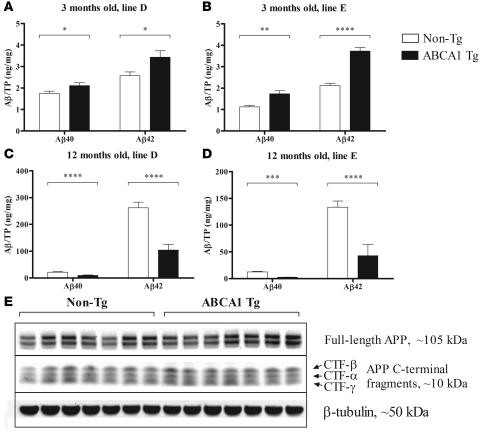
Figure 5. Aβ as detected by ELISA in the hippocampus of PDAPP/Abca1 mice.
(A–D) Aβ was serially extracted from the hippocampus using carbonate and guanidine buffers and measured by ELISA. The Aβ in the carbonate and guanidine extracts was summed, and total Aβ40 and Aβ42 ares represented. TP, total protein in the tissue lysate. (A and B) Aβ in the hippocampus of 3-month-old mice from PDAPP/Abca1 lines D and E, respectively. n = 11 in all groups. (C and D) Aβ in the hippocampus of 12-month-old mice from PDAPP/Abca1 lines D and E, respectively. n = 10–14 in all groups. Statistical analyses of differences between Tg and non-Tg mice were performed using 2-tailed Student’s t test. *P < 0.05; **P < 0.01; ***P < 0.001; ****P < 0.0001. (E) Levels of APP and APP C-terminal fragments in hippocampus from PDAPP/Abca1 line E mice were visualized by Western blotting. n = 7 for both groups. β-Tubulin was used as a loading control. Quantification of the APP and CTF bands using image analysis software revealed no significant differences between PDAPP/Abca1 Tg and PDAPP/Abca1 non-Tg mice.

