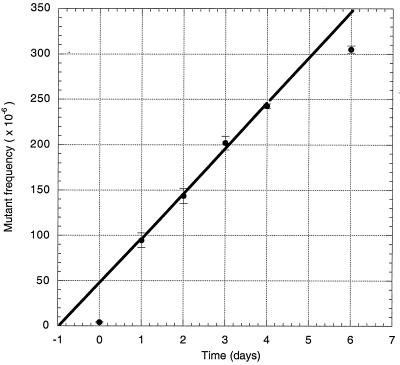
Figure 2.
Increase in the frequency of fluorescent reversions with time. Each point and its associated error bars are means ± SEM; data were taken from Table 1. The curve, which was fitted by the program kaleidagraph (Synergy Software, Reading, PA) to the points for days 1–4 only (see text), corresponds to a mutation rate of about 50 per million cells per day or 25 per million cells per generation time.

