
Figure 3.
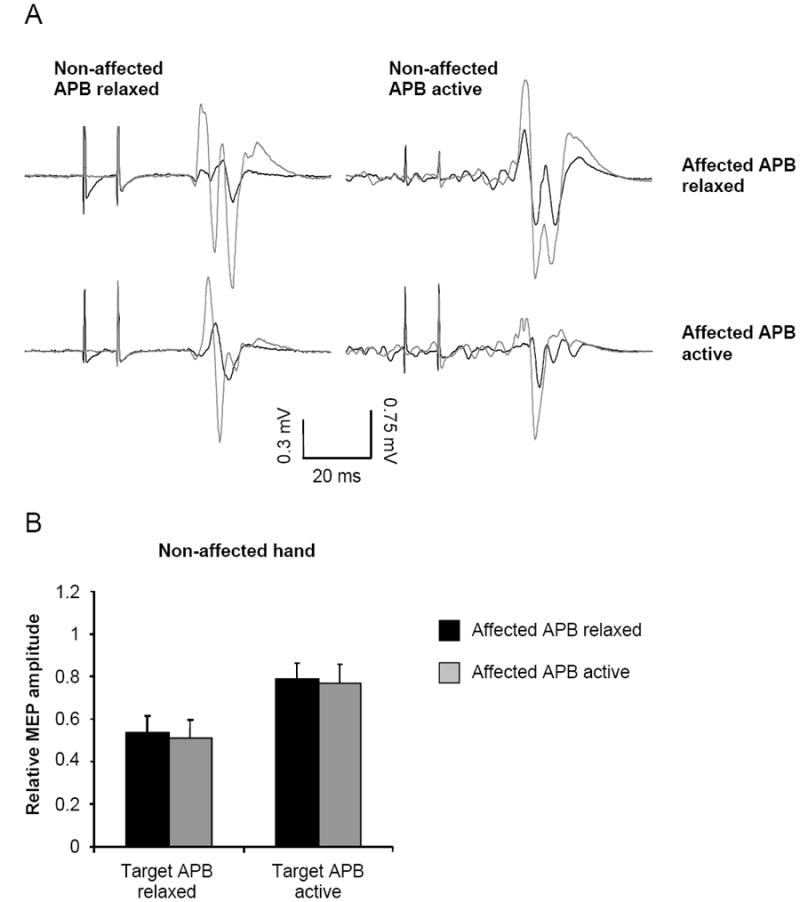
A. Example motor evoked potentials (MEPs; average of 10 stimuli) from a subject with stroke (P5) showing non-conditioned (grey) and conditioned (black) responses. The responses on the left are with the target APB muscle at rest. The responses on the right are with the target APB at 5% maximum voluntary contraction (MVC). Responses obtained with the affected APB at rest are in the top row and responses obtained with the affected APB at 5% MVC are in the bottom row. B. Group data for the stroke subjects showing the extent of interhemispheric inhibition. Relative MEP amplitude is determined as conditioned/non-conditioned MEP amplitude. Bars represent one standard error of the mean.