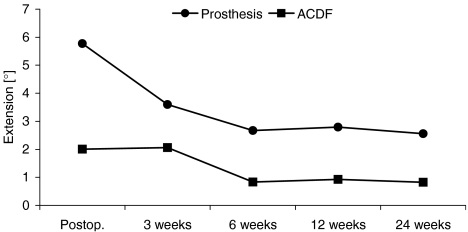
Fig. 4.
Graph illustrating segmental motion in extension (deg) (mean value) for each follow-up examination. For each follow-up examination, the micro-motion of a segment receiving prosthesis is more pronounced when compared to fusion group. However, segmental motion decreases in both groups over time

