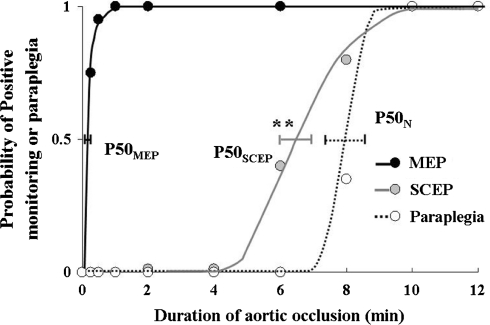
Fig. 4.
Relation of duration of ischemia to probability of paraplegia, probability of amplitude less than 25% of baseline in tc-MEPs and less than 50% of baseline in segmental SCEP. Horizontal bars represent standard errors at the P50 required to produce paraplegia, amplitude less than 25% of baseline in tc-MEPs and less than 50% of baseline in segmental SCEP. ** Significant differences (P < 0.01) in P50SCEP from P50MEP

