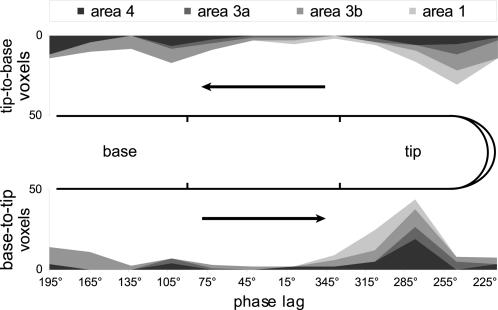
Figure 2. Phase value distributions were nonuniform and tuned to fingertip stimulation.
Distributions of voxels (r≥0.3) are summed across digits (D1 and D2) and subjects, and are shown cumulatively for areas 4, 3a, 3b, and 1 along a linearized axis aligned with the digit surface. In the distributions for both tip-to-base (top; ordinate flipped) and base-to-tip (bottom) stimulation, there was a strong response coincident with stimulation across the fingertip jets. The peak of this response appeared to shift in phase as a function of stimulation direction.

