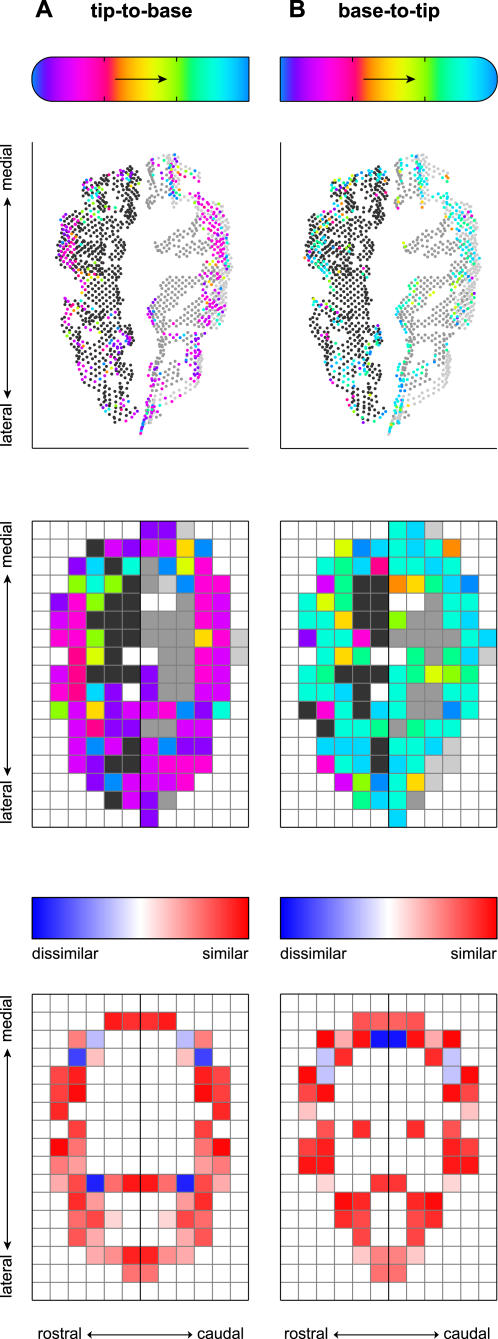
Figure 4. Activation tuning and symmetry in flattened representations of pericentral cortex.
Shown are the same two experiments represented in Figure 3. In each plot the cortex is shown as a 2D surface, oriented in approximate rostrocaudal and lateromedial directions. The top plot shows functional data, representing phase lag according to the reference bar at top, superimposed over MI (rostral) and SI (caudal) voxels in gray, as per the legend used in Figures 2 and 3. (Area 3a, between these regions at the fundus of the central sulcus, is not shown.) The middle plot shows these same data binned into grid cells tiling the pericentral cortex. “Active” grid cells are indicated by the average phase lag across voxels within the bin. Grid cells representing pericentral cortex but lacking any active functional voxels are shown as gray (again, as per the Fig. 2 and 3 legends); cells outside MI and SI are white. The bottom plots depict the degree of similarity between active grid cells lying across from each other an equal distance from the fundus, according to the scale bar immediately above. Pairs of active grid cells with similar phase delays are both colored red; pairs of cells with activity out of phase are colored blue. These examples show widespread functional activity on both sides of the fundus, and indicate that much of this mosaic of activity was mirrored by similar activity on the opposite side of the fundus.

