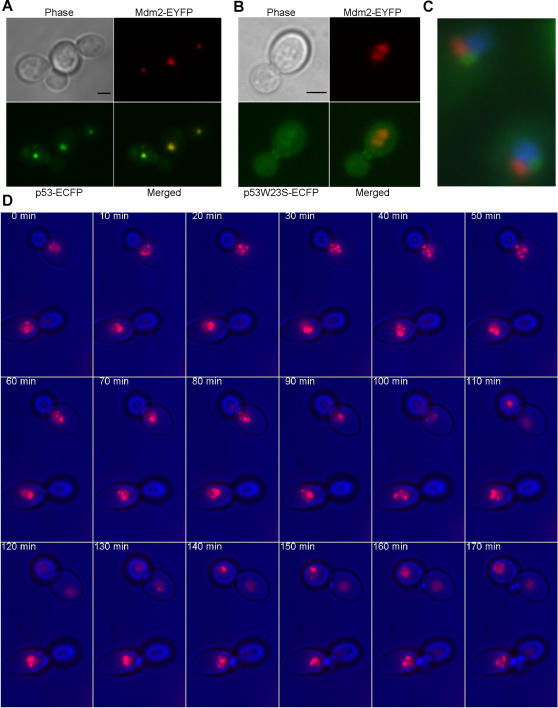
Figure 3. p53 and Mdm2 co-localize in yeast cells.
(A,B) Maximum projections from fluorescence image stacks of live yeast cells expressing the indicated fusion proteins were obtained with a DeltaVision workstation. Bar, 2 µm. (C) Indirect immunofluorescence of fixed yeast cells stained for p53-Mdm2 bodies (primary antibody: goat polyclonal N-19 anti-p53; secondary antibody: Cy2-labeled donkey anti-goat; showed in green), Nop1 (primary antibody: mouse monoclonal; secondary antibody: Cy5-labeled donkey anti-mouse; showed in red) and chromatin (detected with Höechst, showed in blue). (D) Time-lapse microscopy on yeast cells expressing p53 and Mdm2 obtained recording image stacks and then performing maximum projections of live yeast cells at the indicated times. Galactose was added directly into the Petri dish to trigger p53 expression and time-lapse started shortly after. Mdm2 is shown in red and the phase-contrast image of the cells in blue.

