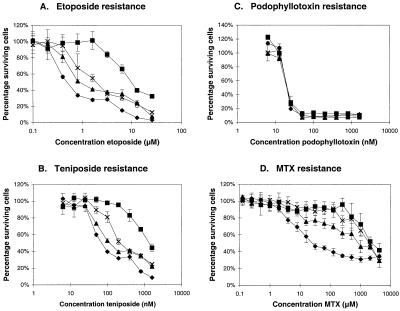
Figure 4.
Representative growth inhibition curves for cytotoxicity experiments with (A) etoposide, (B) teniposide, (C) podophyllotoxin, and (D) methotrexate by using 2008 cells (♦), 2008/MRP1–4 cells overexpressing MRP1 (■), and 2008/MRP3–4 (▴) and 2008/MRP3–8 cells (X) both overexpressing MRP3. A–C, experiments with continuous (96-h) drug exposure. D, experiments with short-term (4-h) drug exposure. The vertical bars for each data point represent ± SD of three replicate determinations. The IC50 values of 2008, 2008/MRP1–4, 2008/MRP3–4, and 2008/MRP3–8 cells in this particular experiment were for etoposide: 0.51 nM, 10.29 nM, 0.88 nM, and 1.99 nM; for teniposide: 0.074 μM, 1.388 μM, 0.120 μM, and 0.226 μM; for podophyllotoxin: 21.68 nM, 21.85 nM, 20.54 nM, and 21.20 nM; for MTX: 0.027 mM, 2.504 mM, 0.887 mM, and 2.030 mM.

