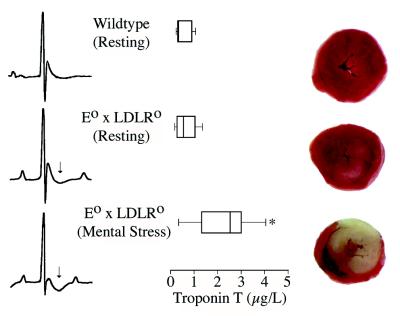
Figure 2.
Mental stress induces ECG changes and myocardial infarction in E0 × LDLR0 mice. ECG tracings (Left), serum troponin T levels (Center), and TTC staining for dehydrogenase activity in the myocardium (Right) are shown. Wild-type C57BL/6J (Top), a resting E0 × LDLR0 mouse (Middle), and an E0 × LDLR0 mouse exposed to the mental stress test (Bottom). ECG: STU segment deviations (arrows) are apparent in resting E0 × LDLR0 mice and exacerbated by stress. Troponin T concentrations are significantly elevated in E0 × LDLR0 mice exposed to mental stress. Concentrations >1 μg/liter are diagnostic for myocardial infarction in humans. Box-and-whisker plot is shown, in which the line in the box corresponds to the median and the top and bottom of the box correspond to the 75th and 25th percentile, respectively. The whiskers extend from the 10th to the 90th percentile. ∗, Significantly different from the other two groups (P < 0.05). TTC staining of heart segments is shown, where red staining indicates viable myocardium with dehydrogenase activity. There is a slight reduction in TTC staining in the myocardium of the resting E0 × LDLR0 mouse and a drastic loss of TTC dehydrogenase activity in the myocardium of the E0 × LDLR0 mouse exposed to mental stress.

