Figure 6.

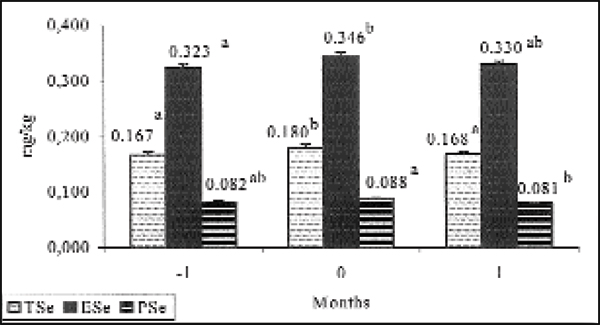
Whole blood Se (TSe), erythrocyte (ESe), and plasma selenium (PSe) concentrations (mg/kg, LSM ± SEM) in blood samples taken one month before expected calving (-1), at calving (0), and one month after calving (+1) from ten dairy cows. Values with different letters within each parameter differ significantly (p < 0.05).
