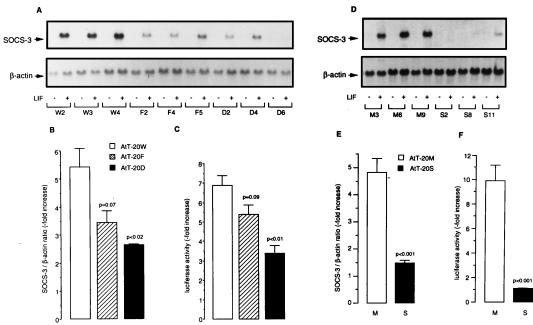
Figure 4.
Effect of overexpressed dominant negative STAT-3 mutants or wt SOCS-3 on LIF-induced SOCS-3 promoter activity and gene expression. Corticotroph AtT-20 cells overexpressing wt STAT-3 (AtT-20W) or dominant negative STAT-3 mutants (AtT-20F and AtT-20D), as well as wt SOCS-3 (AtT-20S) and mock-transfected (AtT-20M), were isolated after stable transfection, as described (15, 28). (A and D) Cells were treated with 0.5 × 10⁻⁹ M LIF for 45 min. Northern blot analysis was performed with 15 μg total RNA per lane; shown is a representative experiment. (Upper) SOCS-3 mRNA. (Lower) β-actin mRNA. (B and E) Northern blot signals for SOCS-3 mRNA were analyzed by quantitative densitometry and normalized for β-actin. The relative increase of LIF-induced SOCS-3 mRNA was calculated from three independently performed experiments. Each experiment was performed with three different clones per group. (C and F) Luciferase activity of a −2757/+929 murine SOCS-3 promoter-pGL3Basic construct (clone 6) was measured in different cell clones and treated with 0.5 × 10⁻⁹ M LIF. LIF-induced luciferase activity was normalized to the untreated control for each clone. Relative induction of luciferase activity after stimulation was calculated from three independently performed experiments. Each experiment was performed with three independent clones per group.

