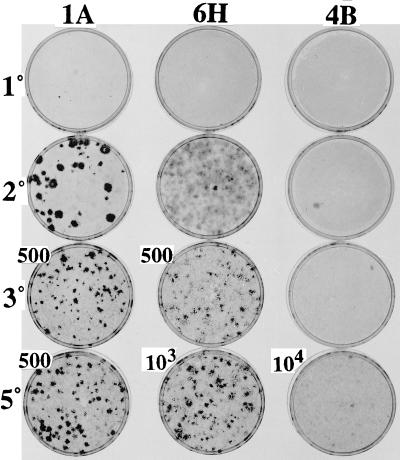
Figure 3.
Progressive transformation of clones in serial assays at confluence after five LDPs (first series). The three clones shown here illustrate the variable extent of transformation and progression in serial assays at confluence initiated after five LDPs (first series). The designations on the left side of each row (1°, 2°, 3°, 5°) represent the serial assay. The numbers (500, 103, 104) next to the particular dishes refer to the number of clonal cells seeded together with 105 A′ cells. Where no numbers are shown, 105 cells from the clone were assayed with no A′ cells. See Table 2.

